
Introduction
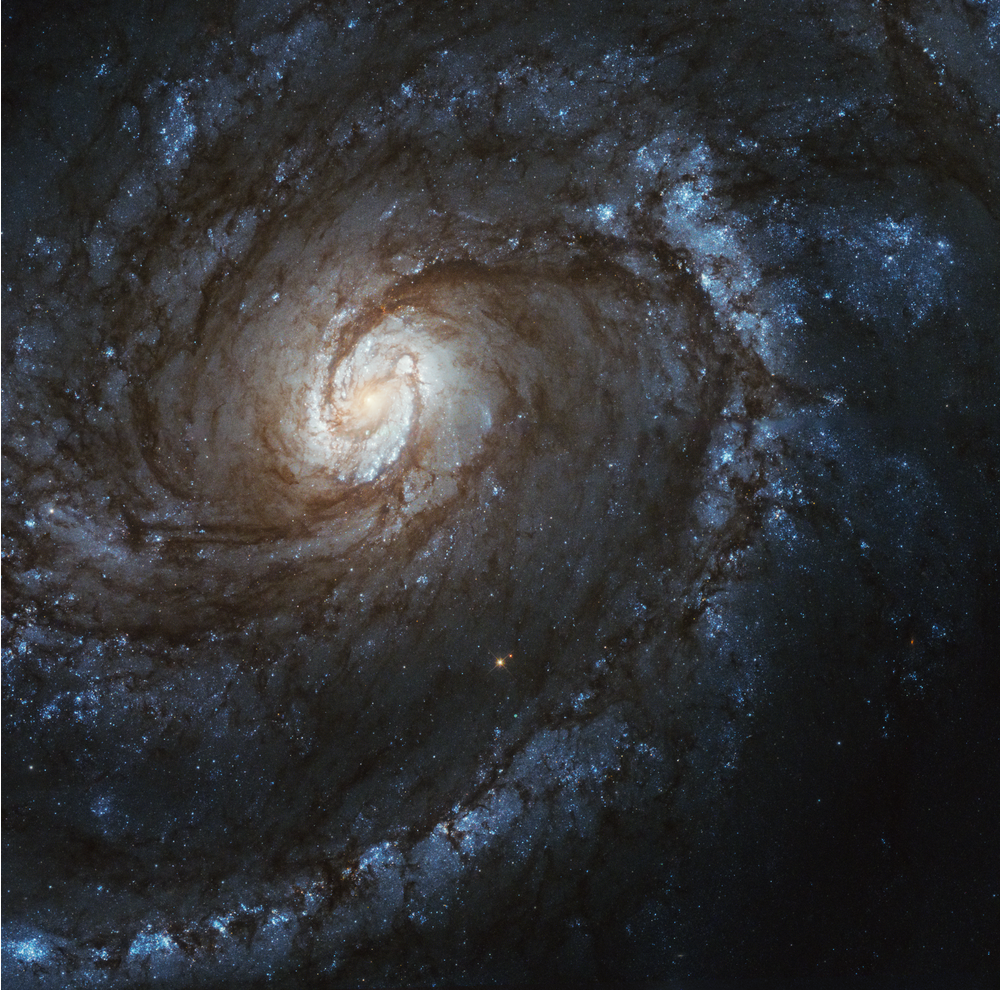
Galaxies are huge collections of stars which are held together by gravity. Often, large galaxies have centers (also called nuclei) which contain supermassive black holes. Some galaxies appear “active” when large amounts of stars, gas and other material get fed into the black hole and this process also releases matter and light away from the center. Depending on which orientation this process is viewed from, Active Galactic Nuclei can be observed as huge amounts of light of different energies which changes over time (but doesn’t usually repeat periodically like other variable objects). At first, these objects were given different names because astronomers didn’t know they were usually AGN viewed from different angles. Some of the most powerful objects in the Universe, studying AGN can help us understand how physics works at the extreme limits where huge amounts of matter and energy come together in small spaces. NASA’s Fermi mission has measured thousands of AGN and helped link these objects to the production of strange particles called neutrinos which are incredibly difficult to detect on Earth.
Galaxy Spectra
Galaxies are studied mostly through the light they emit. When astronomers study an object, they often spread its light out into the constituent wavelengths or energies that the light contains. For visible light these are seen as different colors. The light is often displayed on a graph, with brightness plotted against wavelength. The brightness can also be plotted against energy or frequency… these are all basically equivalent. Such a plot is called a spectrum. Studying the spectra of astronomical objects is how many astronomers spend their time. This is because understanding an object’s spectrum is the key to knowing many things about it. Below we discuss some general features of galaxy spectra.
In addition to morphology, as described above, the spectra of galaxies can also be used as an aid in classifying them. The spectrum of a galaxy is produced mostly by the stars it contains, and so galaxies generally show the same spectral lines commonly seen in stars. Of course, the lines are broadened due to the galaxy’s rotation since, at any given moment, some stars are moving toward us, while others are moving away. These motions shift the position of the lines according to the Doppler shift formula. So one thing we can measure from the spectrum of a galaxy is the speed at which its stars move within it (which in turn allows us to measure its mass). But we can learn many other things about a galaxy from its spectrum. In particular, the presence of strong emission lines in a galaxy’s spectrum is a sign of star formation.
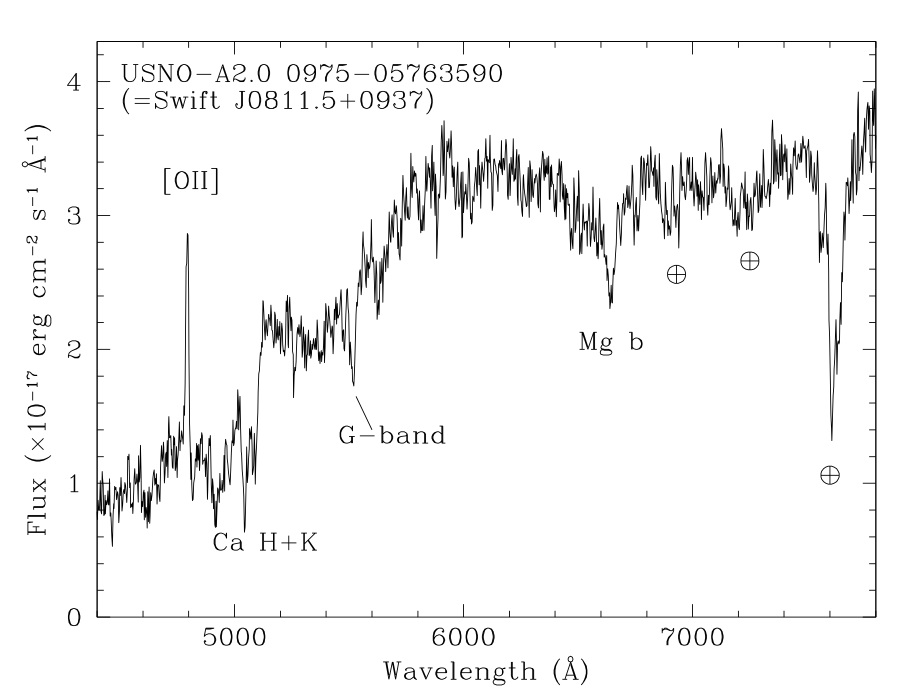
The spectra below at right are both taken from Parisi et al., 2009 (arXiv:09095345v1). Each is a plot of flux (in erg per square centimeter per second per angstrom) vs wavelength, here plotted in Ansgstrom units (1 angstrom is 0.1 nanometers, or 10-10 meters). To break this down, the plots show how much energy (in ergs) from the galaxy passes through each square centimeter of the detector during each second at each wavelength plotted (in angstroms). For reference, the bluest light visible to humans has a wavelength just short of 4000 angstroms, and the reddest light visible is around 7000 angstroms. So this spectrum runs from violet to just beyond the red part of the spectrum in the near infrared. Of course, the electromagnetic spectrum continues to shorter wavelengths (ultraviolet) and longer (infrared), but our eyes cannot see this radiation. Our detectors can, but those wavelengths have not been measured for these spectra.
You should keep in mind that these galaxies are at great distances, so their spectra have both been redshifted by the expansion of the universe. As a result, the lines shown are not at the wavelengths they would have in the lab. Despite these shifts, the patterns of the lines are the same as they would be in a nearby galaxy; the redshift effect only shifts the pattern. Redshift acts on each wavelength the same, shifting it by the same percentage as all other wavelengths.
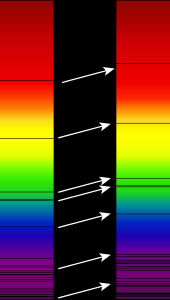
Redshifted absorption lines on a spectrum
Elliptical Galaxies
This spectrum is from an elliptical galaxy. Notice the lack of most of the emission lines seen in the spiral galaxy, above. The only emission line seen is OII, which in this galaxy has been shifted to almost 5000 angstroms (it has a rest wavelength of 3727 angstroms). Like the example above, this is an active galaxy. If it were a normal elliptical there would be no emission lines at all. From the previous discussion of spirals you will deduce that the lack of emission lines in elliptical galaxies results from them having no star formation, and thus no ionized gas clouds. However, this last statement is somewhat misleading. Elliptical galaxies do contain ionized gas, but it is at temperatures higher than a million kelvin. At these temperatures the gas is so hot and highly ionized that it emits x-rays. We do not see any sign of this hot gas in the optical spectra shown. The gas in spirals, on the other hand, has a range of temperatures from only a few kelvin in the cores of molecular clouds, to about ten thousand kelvin in the ionized clouds responsible for the emission lines. You may notice that the absorption lines in this elliptical galaxy seem much more pronounced than the ones seen in the spiral spectrum. This is not really the case. The presence of the strong emission lines in the spiral spectrum makes the vertical scale somewhat compressed. The continuum (the continuum is the average value of the spectrum, ignoring emission and absorption lines) appears flatter in the spiral, and the lines seem to be not as deep as in the elliptical. In some spiral galaxies the emission lines are so strong that the continuum appears completely flat, but this is just an artifact of how we have chosen to plot the graph, with a linear vertical scale. If we blew up the vertical scale we would see that the continuum in both galaxies is about the same, with the same rough shape and similar absorption features. In both galaxies the continuum is produced by cool giant stars for the most part. So, aside from the emission lines from the star forming regions in the spirals, their spectra are similar to the spectra of ellipticals.
Supernovae
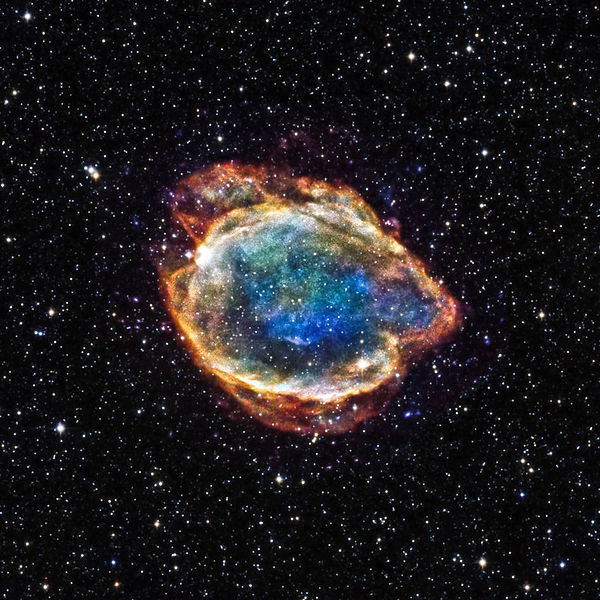
Supernovae (SNs) are produced in many different ways as stars evolve. In all cases, an extremely bright outburst is observed, which declines over many weeks – months as the explosion propagates outward, creating a supernova remnant. Type II supernovae are the result of massive stars exploding when they run out of nuclear fuel. Type 1a supernovae result from collapsing white dwarf stars which have gotten too heavy to sustain nuclear burning. To learn more about supernova light curves, and how they can be used to measure the expansion of the Universe, see Discover Supernova.
Credit: X-ray: NASA/CXC/U.Texas/S.Post et al, Infrared: 2MASS/UMass/IPAC-Caltech/NASA/NSF
Unusual stars with outbursts or other unpredictable activity
Monitor stars with known unpredictable activity. (note: Professional observatories generally do not allocate observing time for such observations.) Normally such stars are quiescent and not active. These stars should be monitored because such events are unpredictable. When such events occur, the astronomical community should be notified so specialized instrumentation at professional facilities can be used to study these events.
Stars with unpredictable activity:
Cataclysmic variables (CVs)
- Dwarf novae
- Recurrent novae
- Novae
- Polars
RCB stars (inverse novae)
YSOs (Young Stellar Objects)
Variable nebulae (likely illuminated by YSOs)
SR stars (semi-regular variables)
Supernovae
Follow the decline of a supernova. Supernovae (SNs) are classified as cataclysmic variables, but the outburst is far brighter than other forms of CVs.
https://en.m.wikipedia.org/wiki/File:G299-Remnants-SuperNova-Type1a-20150218.jpg
Spiral Galaxies
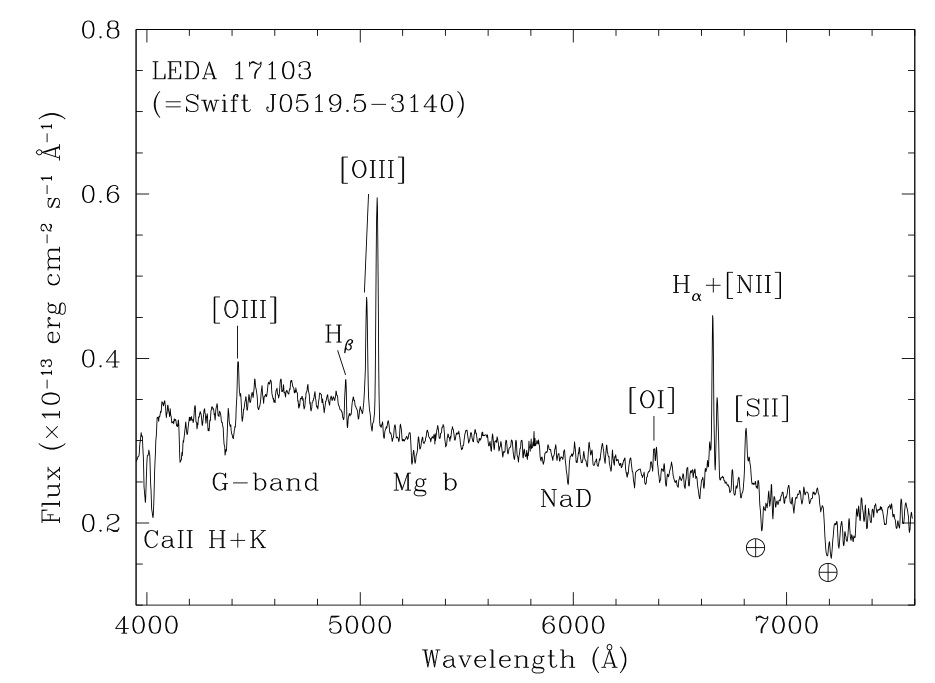
This first spectrum is from a spiral galaxy. Notice the strong emission lines of oxygen (near 5000 angstrom) and hydrogen (just short of 7000 angstrom). Other emission lines are seen as well. Those from sulphur (S), nitrogen (N) and helium (He) are labeled. These lines are produced by hot, ionized gas clouds which are often seen in regions where stars are forming. As a result, the presence of these emission lines in a galaxy means it is forming stars. Only spirals and some irregular galaxies form stars, so just from looking at this spectrum you can tell that the galaxy is not an elliptical. The Roman numerals after the chemical symbols indicate the ionization state of that atom. OI refers to neutral oxygen, OII is singly ionized oxygen (loss of one electron) and OIII is doubly ionized oxygen (loss of two electrons). The presence of the helium emission lines indicate that this is no ordinary spiral galaxy. In fact, it harbors an AGN, and is therefore an active galaxy. This is also indicated by the broadening of the lines of hydrogen (especially H-alpha), nitrogen and sulphur. In addition to the emission lines, several different absorption lines are seen in this galaxy. The absorption lines will be discussed below in the description of the elliptical galaxy spectrum. You can click on these images to view a larger version if you wish.
Click here to go to ViewSpace’s light spectrum activity with two colliding spiral galaxies.