Distance Scales in Astronomy
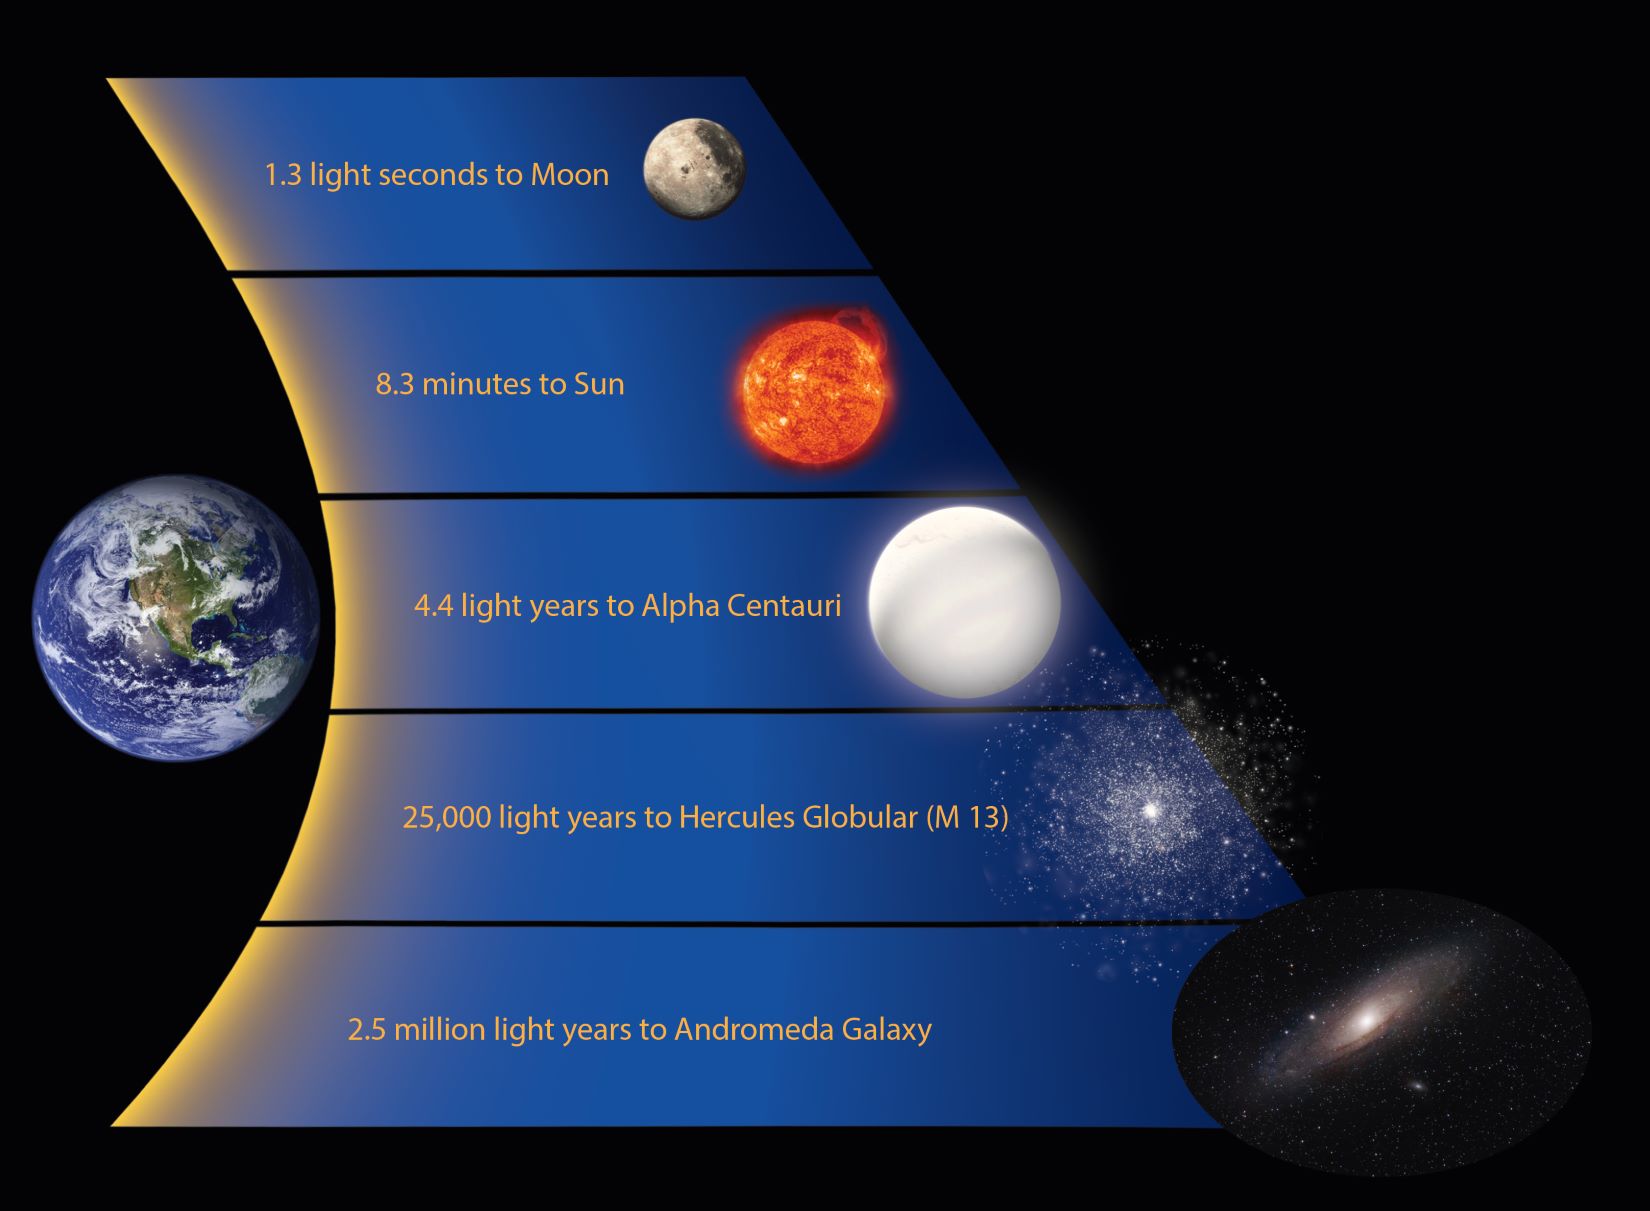
When you peer into the night sky through a telescope, the stars, nebulae, and galaxies you might observe are located at prohibitively vast distances away from the Earth. In fact, the distances are so vast that astronomers often measure these distances in light-years, or the distance that light travels during a period of one year in a vacuum. Since the speed of light represents the fastest speed possible in our current understanding of physics, distances measured in light travel time also represent the minimum amount of time needed to travel to said objects. Proxima Centauri, the closest star to the Sun, is located at a distant 4.3 light-years away (though it would take our fastest space probes tens of thousands of years to visit it). Our galaxy, the Milky Way, has a diameter spanning perhaps 100,000-200,000 light-years, and our closest galactic neighbors, the Large and Small Magellanic Clouds are some 150,000-200,000 light-years away from Earth. The Andromeda Galaxy which is on a collision course with our Milky Way, is currently located some 2.5 million light-years away, and the entire observable universe has a diameter measured in the tens of billions of light-years. Since we can’t hope to visit these places directly, the best way for us to learn about the properties of astronomical objects is by studying the particles (e.g. neutrinos) or waves (e.g. electromagnetic or gravitational) emitted from them.
The Electromagnetic Spectrum
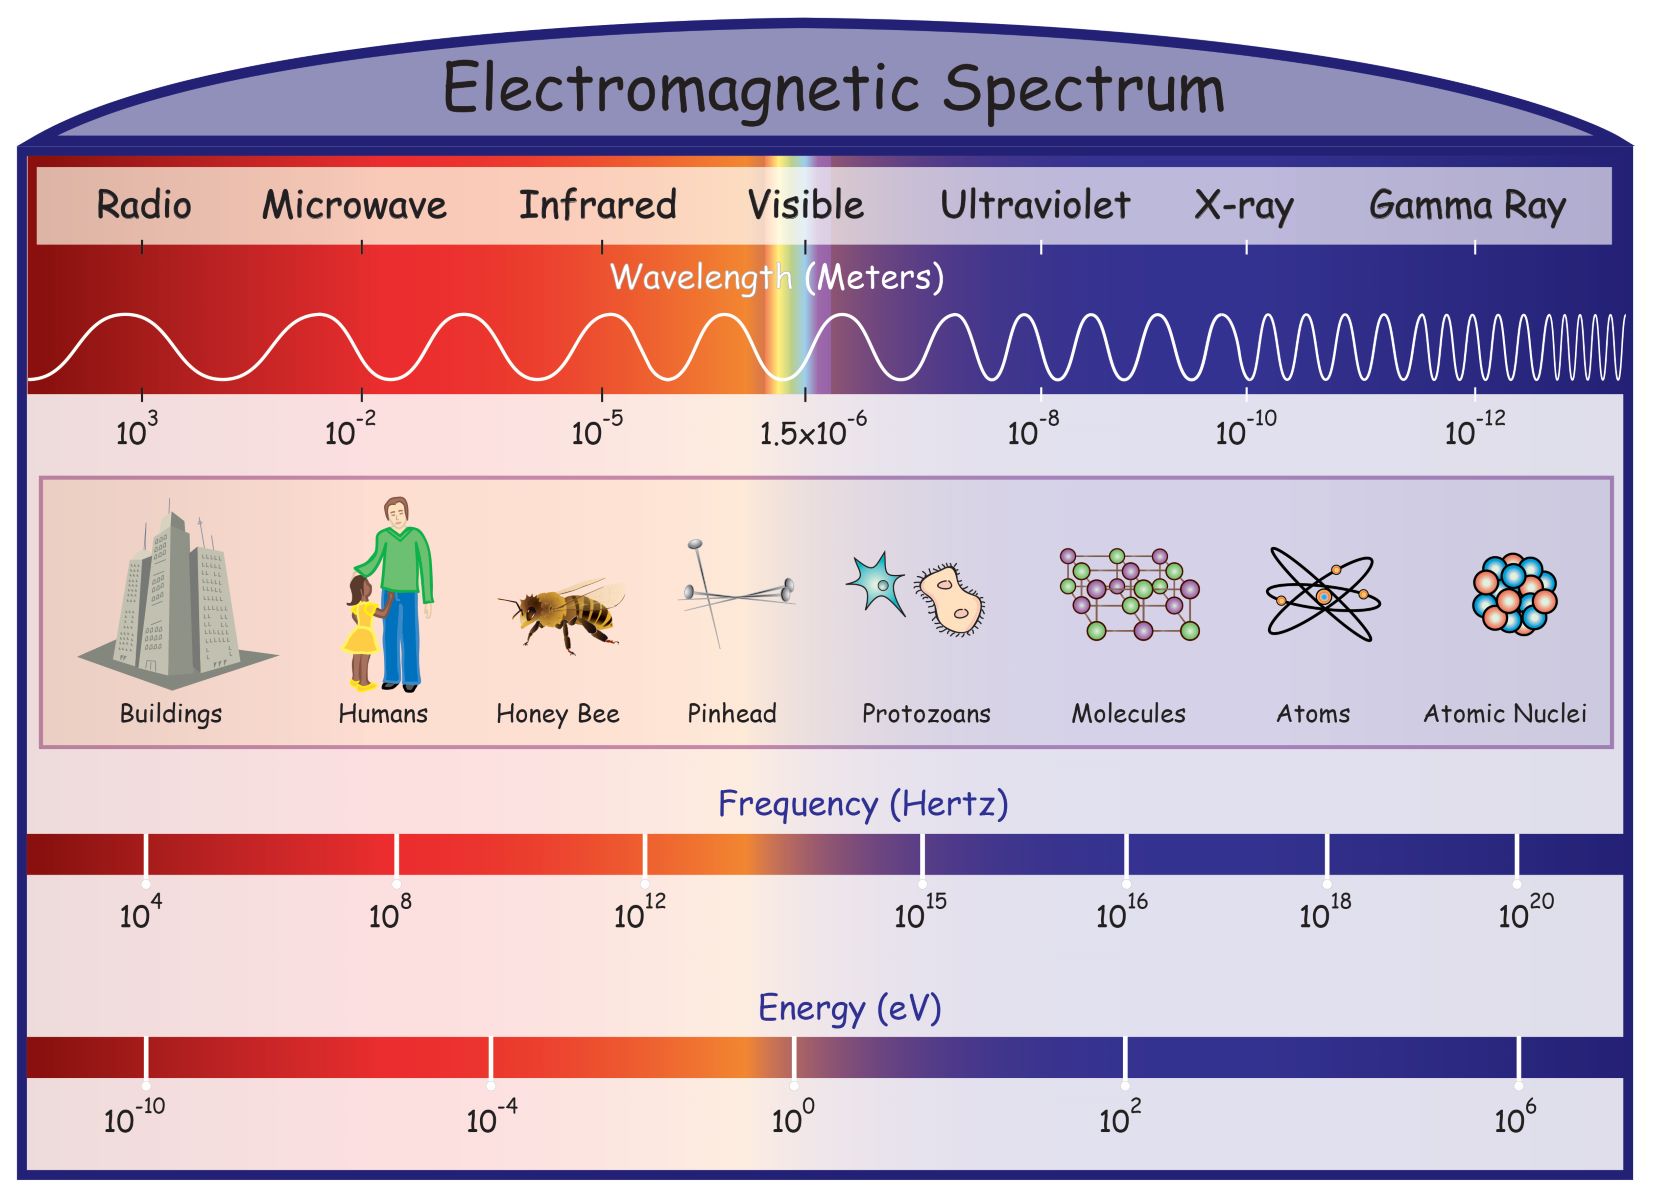
The electromagnetic spectrum spans from the lowest-energy radio waves, through the regions of microwave, infrared, visible, ultraviolet, and X-ray radiation, and ultimately into the highest-energy gamma rays. Since each region of the electromagnetic spectrum is associated with different energy bands, the electromagnetic radiation emitted by an astronomical object can tell us a lot about it. We can only begin to approach a complete understanding of these objects by studying them in as many different bands of the electromagnetic spectrum as possible. Relatively cool objects, such as planets or interstellar clouds of dust, primarily emit radio, microwave, and infrared radiation. As you might expect, hotter objects will primarily emit radiation in more energetic regions of the electromagnetic spectrum: for example, stars primarily emit visible or ultraviolet radiation, and the hot gas within the accretion disk of a black hole can emit X-rays. Generating gamma rays requires even more energetic conditions – for example, when charged particles are accelerated to relativistic velocities by the intense magnetic fields of pulsars or spinning supermassive black holes. But none of these environments compare to the energies involved in the creation of gamma-ray bursts (GRBs).
A Brief History of Gamma-Ray Astronomy
GRBs were first detected in the 1960s by the United States military’s Vela satellite program, which had originally been designed to search for nuclear weapons testing performed by the Soviet Union during the Cold War. Although scientists were able to determine the GRBs were not of terrestrial origin, their source remained a mystery for decades to come. During this time, most scientists assumed the GRBs originated from within the Milky Way Galaxy, since the amount of power required to produce them would be incomprehensible otherwise; however, in 1991, data from NASA’s Burst And Transient Source Experiment (BATSE) showed that GRBs were isotropic (i.e. they were randomly distributed throughout the sky with no bias toward any particular direction). Since the GRBs weren’t clustered about the disk of the Milky Way, this strongly implied that many of them were originating from beyond our own galaxy. Subsequent studies have confirmed this, with the farthest GRBs yet detected originating from billions of light years away. These distances imply that GRBs are incredibly energetic events – second only to the Big Bang in terms of total energy released. The sheer amount of energy needed to produce a GRB was initially puzzling to scientists until they realized that the gamma rays might be beamed (i.e. focused into jets rather than dispersed uniformly in all directions). In fact, when scientists began to model GRBs as beamed events, they realized that this reduced the energy requirements to what one would expect to see in the environment immediately surrounding the birth of a black hole, suggesting a possible link between the two events.
The Matching Game
This online activity includes information on 15 gamma ray bursts organized onto circular cards. Carefully examine the information provided on each card by mousing over them. Your goal is to organize the cards into different groups based on their shared characteristics. To place a card within a group, simply click and drag it into one of the six colored blocks near the bottom of the window. Although six blocks have been provided, not all of them may need to be used in order to adequately categorize the bursts. At any time, you may click the “Show Table” button in order to see the details of all 15 bursts organized into a table (clicking the button again will hide the table). Placing a card onto one of the colored blocks will cause it to become highlighted on the data table based on your selection. Use the data table as is convenient in order to better visualize the shared characteristics of your groupings. At any time, you can click the square with the diagonal arrows in the bottom right corner to enter full-screen mode (press escape to exit). After you have categorized all of the GRBs, a “Done” button will appear that you can press whenever you are satisfied with your groupings. Pressing the “Done” button will evaluate your categories and display a message letting you know how well you did. If you are satisfied with your results, you can press the “Next” button that appears in order to read additional information about each type of GRB. If your groupings aren’t entirely consistent with how scientists have categorized the GRBs, you can hit the “Keep Playing” button to modify your selections until you are satisfied. Below is a sample card along with a detailed description of the information included.
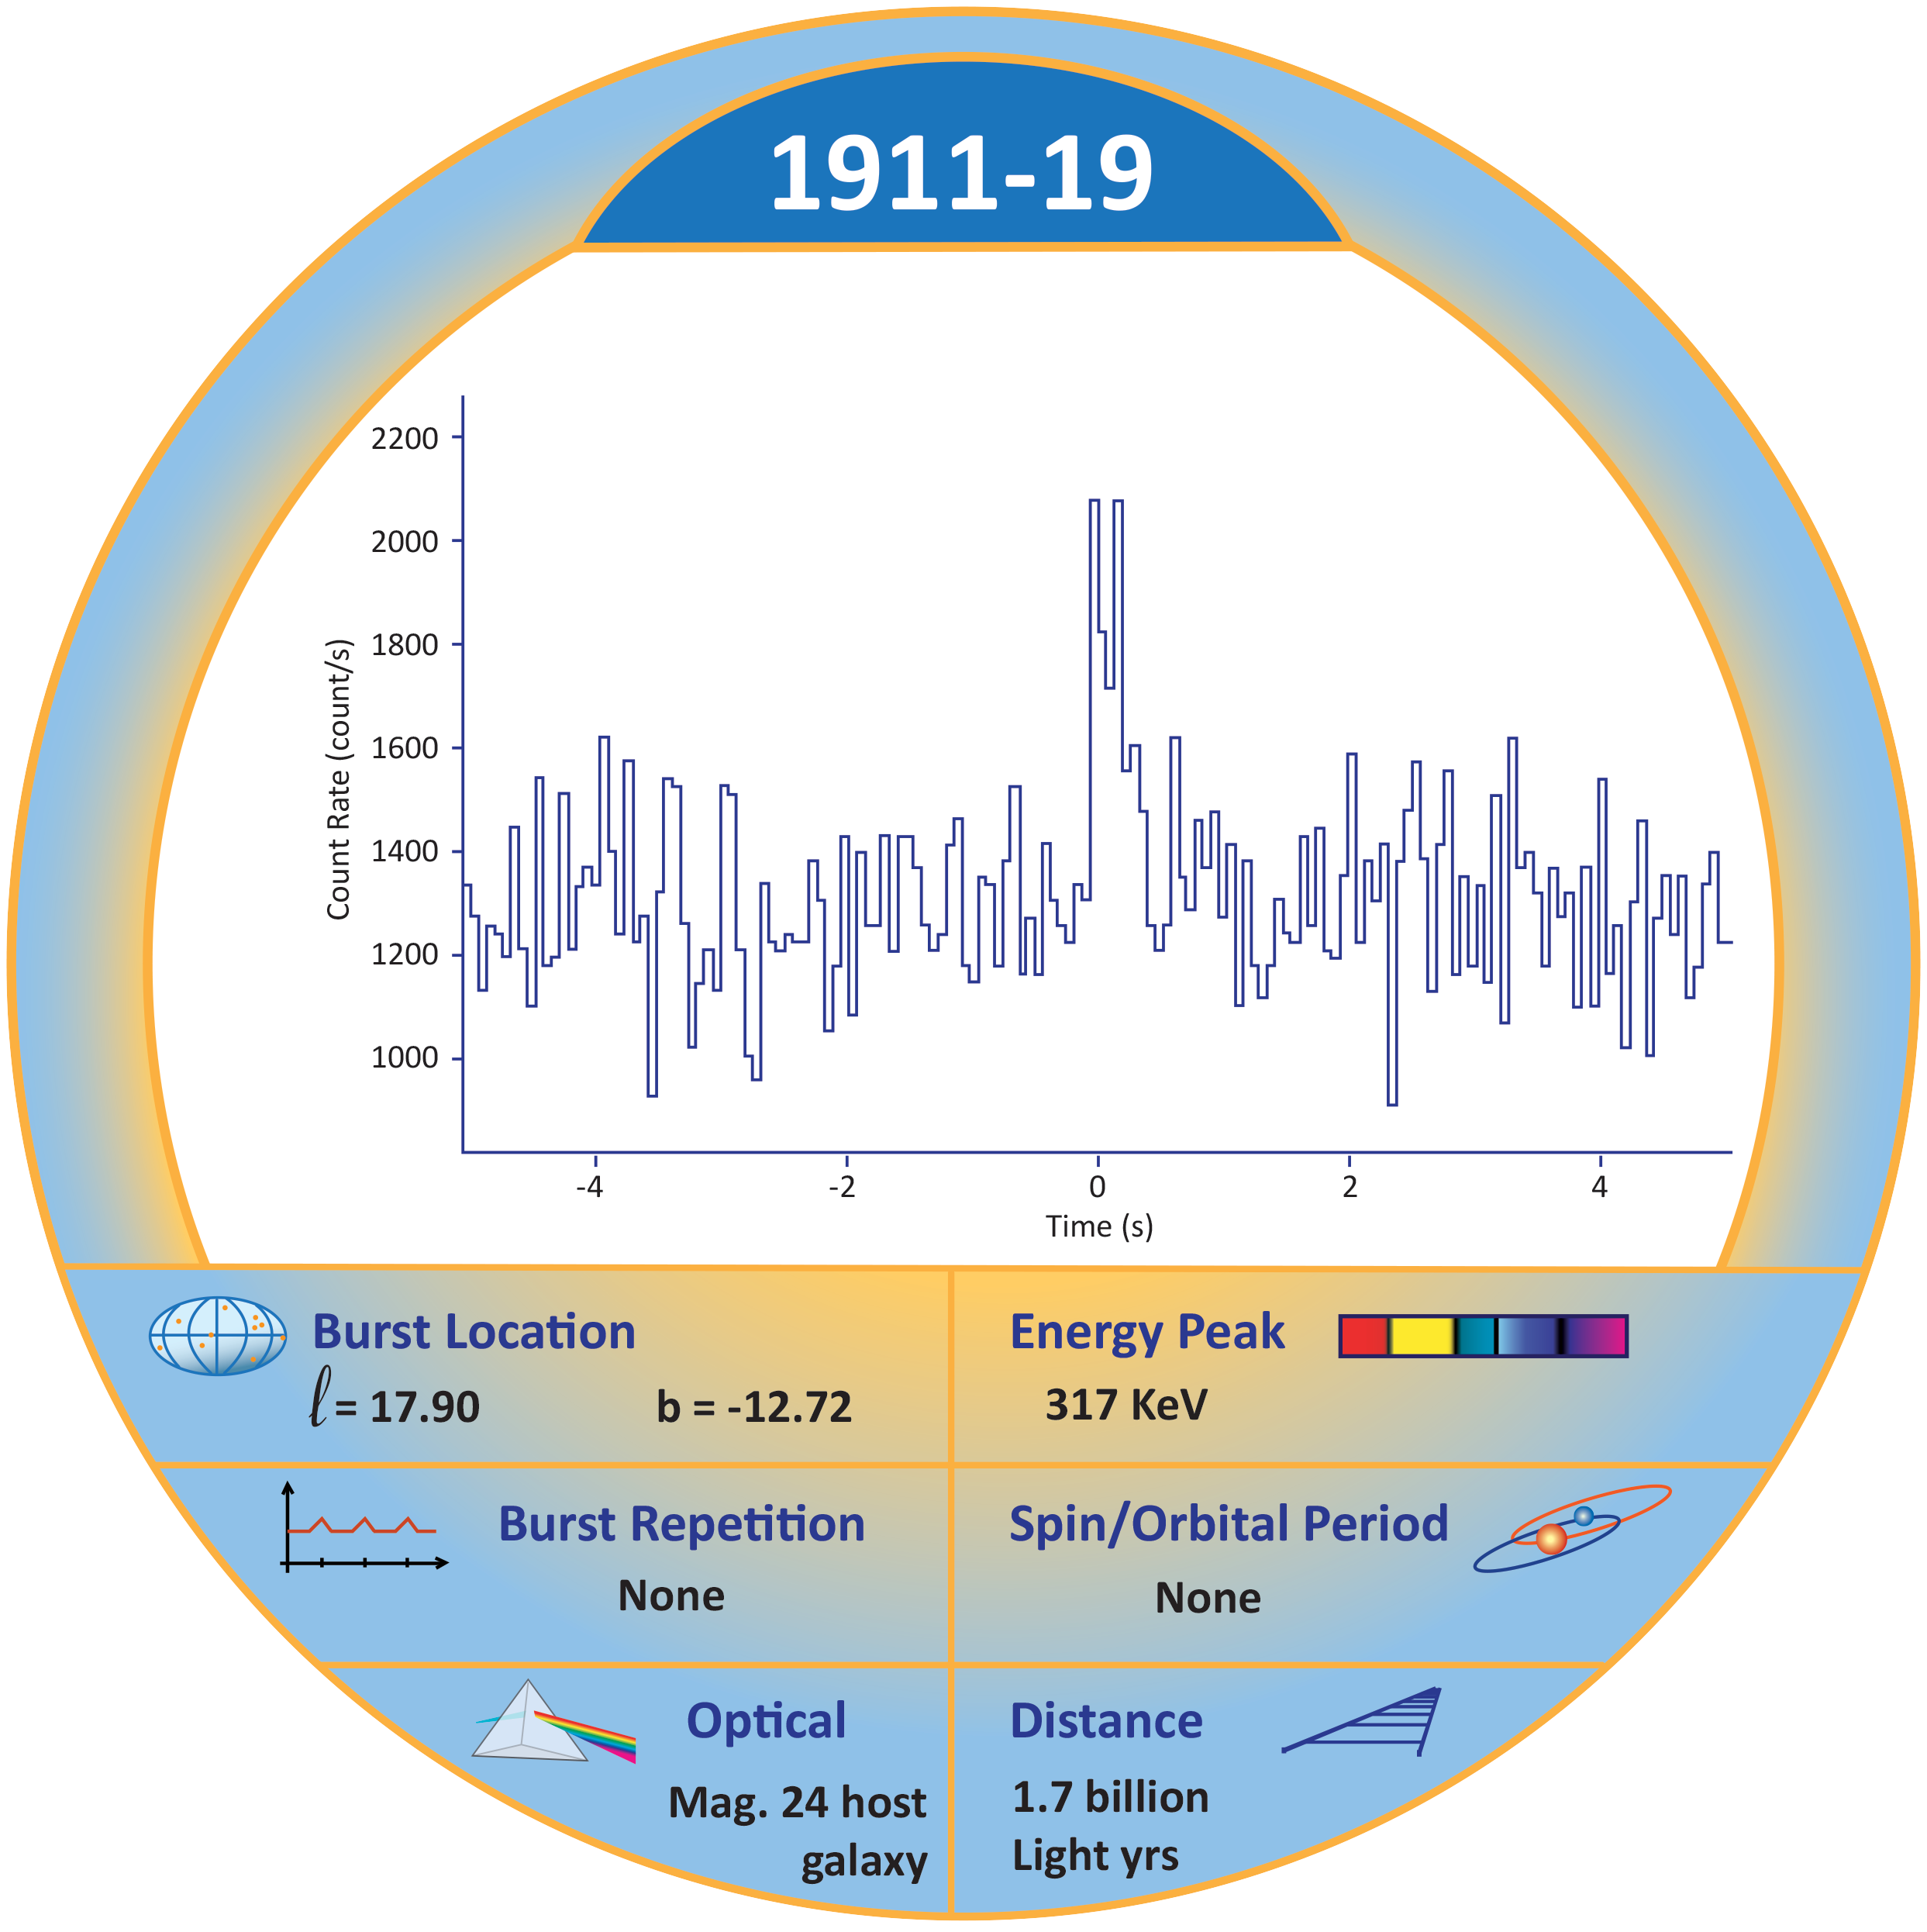
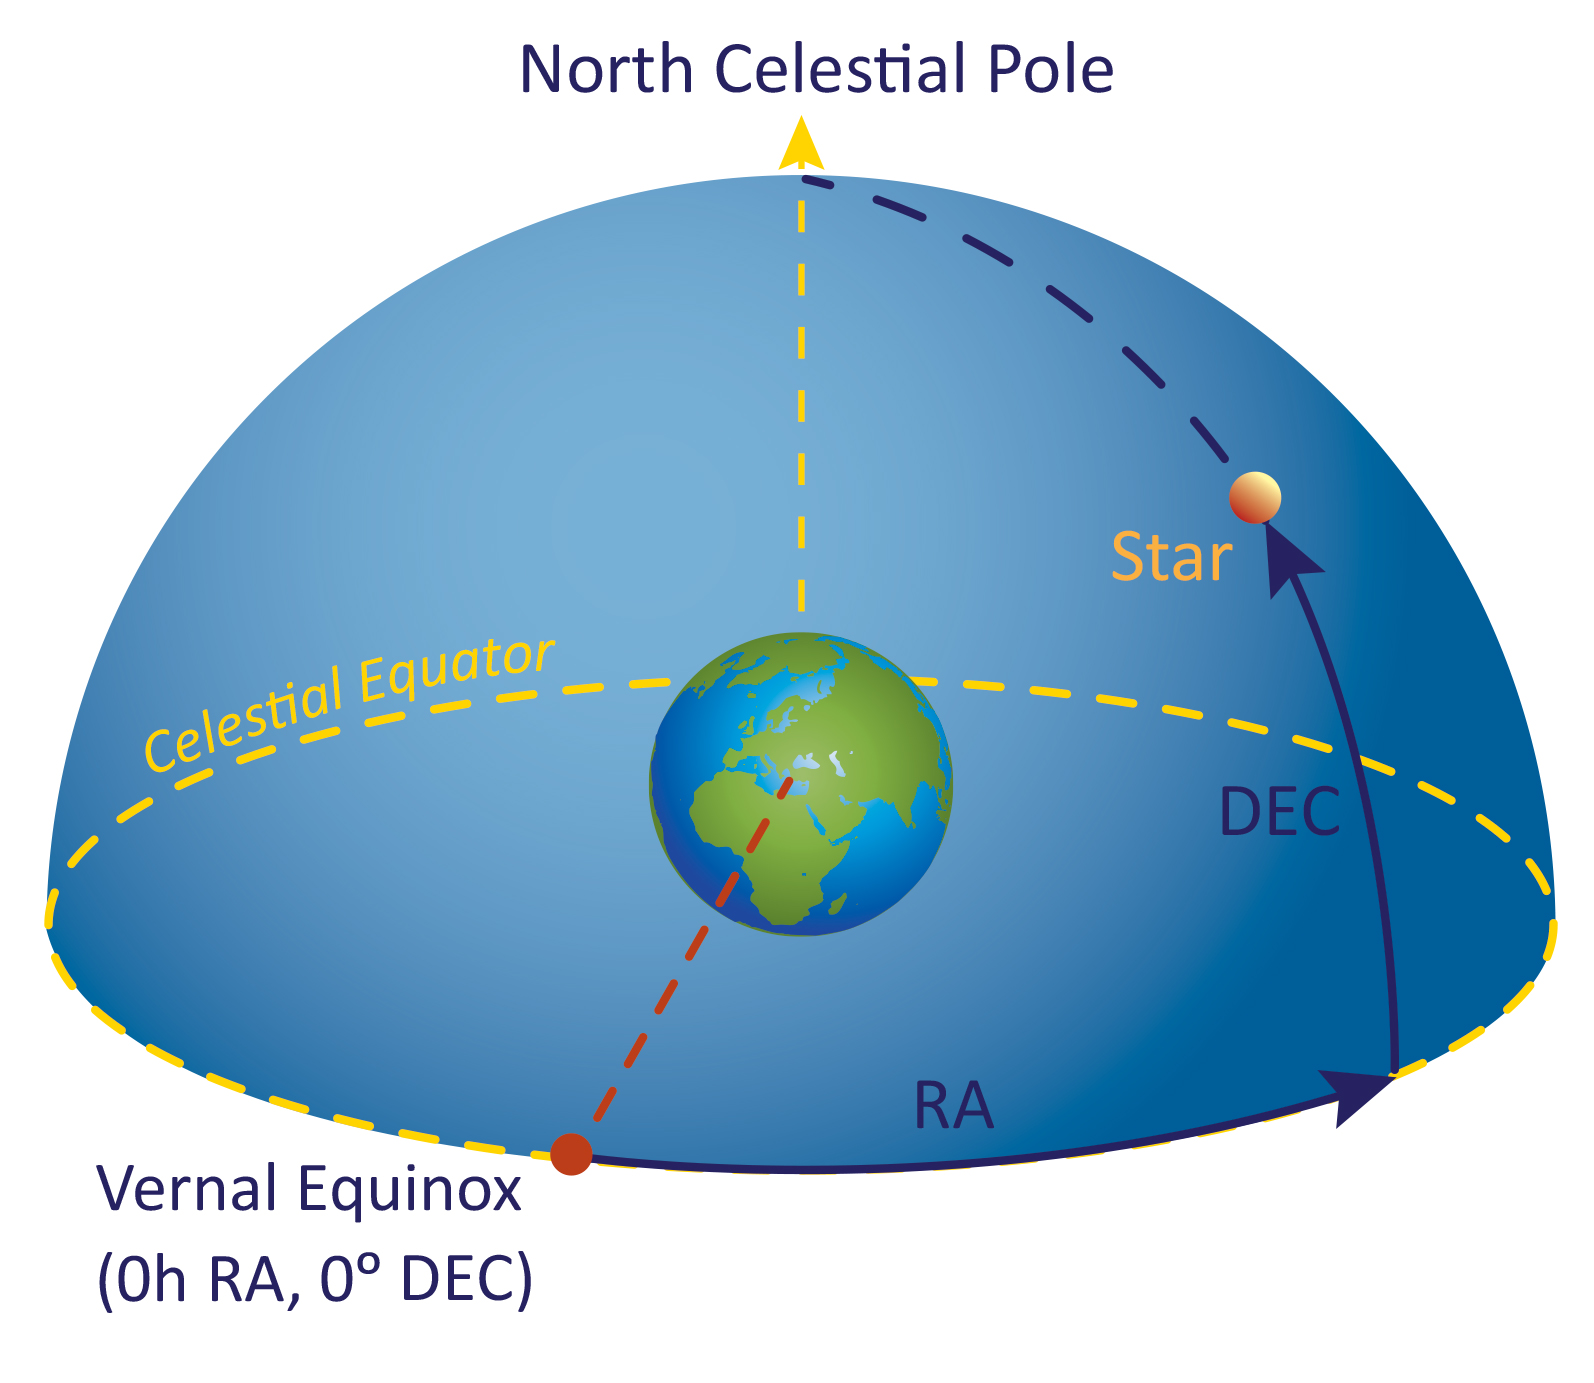
Near the top of the card is the object’s name, which reflects its location in the sky as measured in equatorial coordinates. The equatorial coordinate system uses the Earth as a reference point for mapping objects in the sky by projecting the plane of the Earth’s equator onto the celestial sphere. The axes of the equatorial coordinate system are right ascension (or RA, which measures the angular position of the object around the celestial equator) and declination (or DEC, which measures the angular position of the object above or below the celestial equator). Right ascension measurements can range from 0 to 24 hours (with 24 hours representing a full 360º rotation, and each hour able to be subdivided into 60 minutes), and declination measurements can range from -90º to +90º (corresponding to the South and North celestial poles, respectively). An object with a right ascension of 19 hours and 11 minutes and a declination of -19º would thus have the name 1911-19.
Just below the object’s name is a plot of the intensity of the observed gamma ray burst over time, known as its light curve. Note the various time scales used to measure each of the bursts (Is it measured in fractions of a second? Tens of seconds?). A characteristic time interval used by astronomers to describe these events is known as the object’s T90, which represents the amount of time needed to detect 90% of the photons associated with the burst. See if you can roughly estimate the T90 for each of the objects. The T90 values for many of the objects are included in the data table (if the object is associated with repeated burst events, these data have been omitted, since each event will have its own T90 associated with it, and the light curve provided on the card is merely the measurement of one such burst). Below the object’s light curve are a number of properties associated with it, including its location, energy peak, burst repetition, spin or orbital period, optical source, and distance.
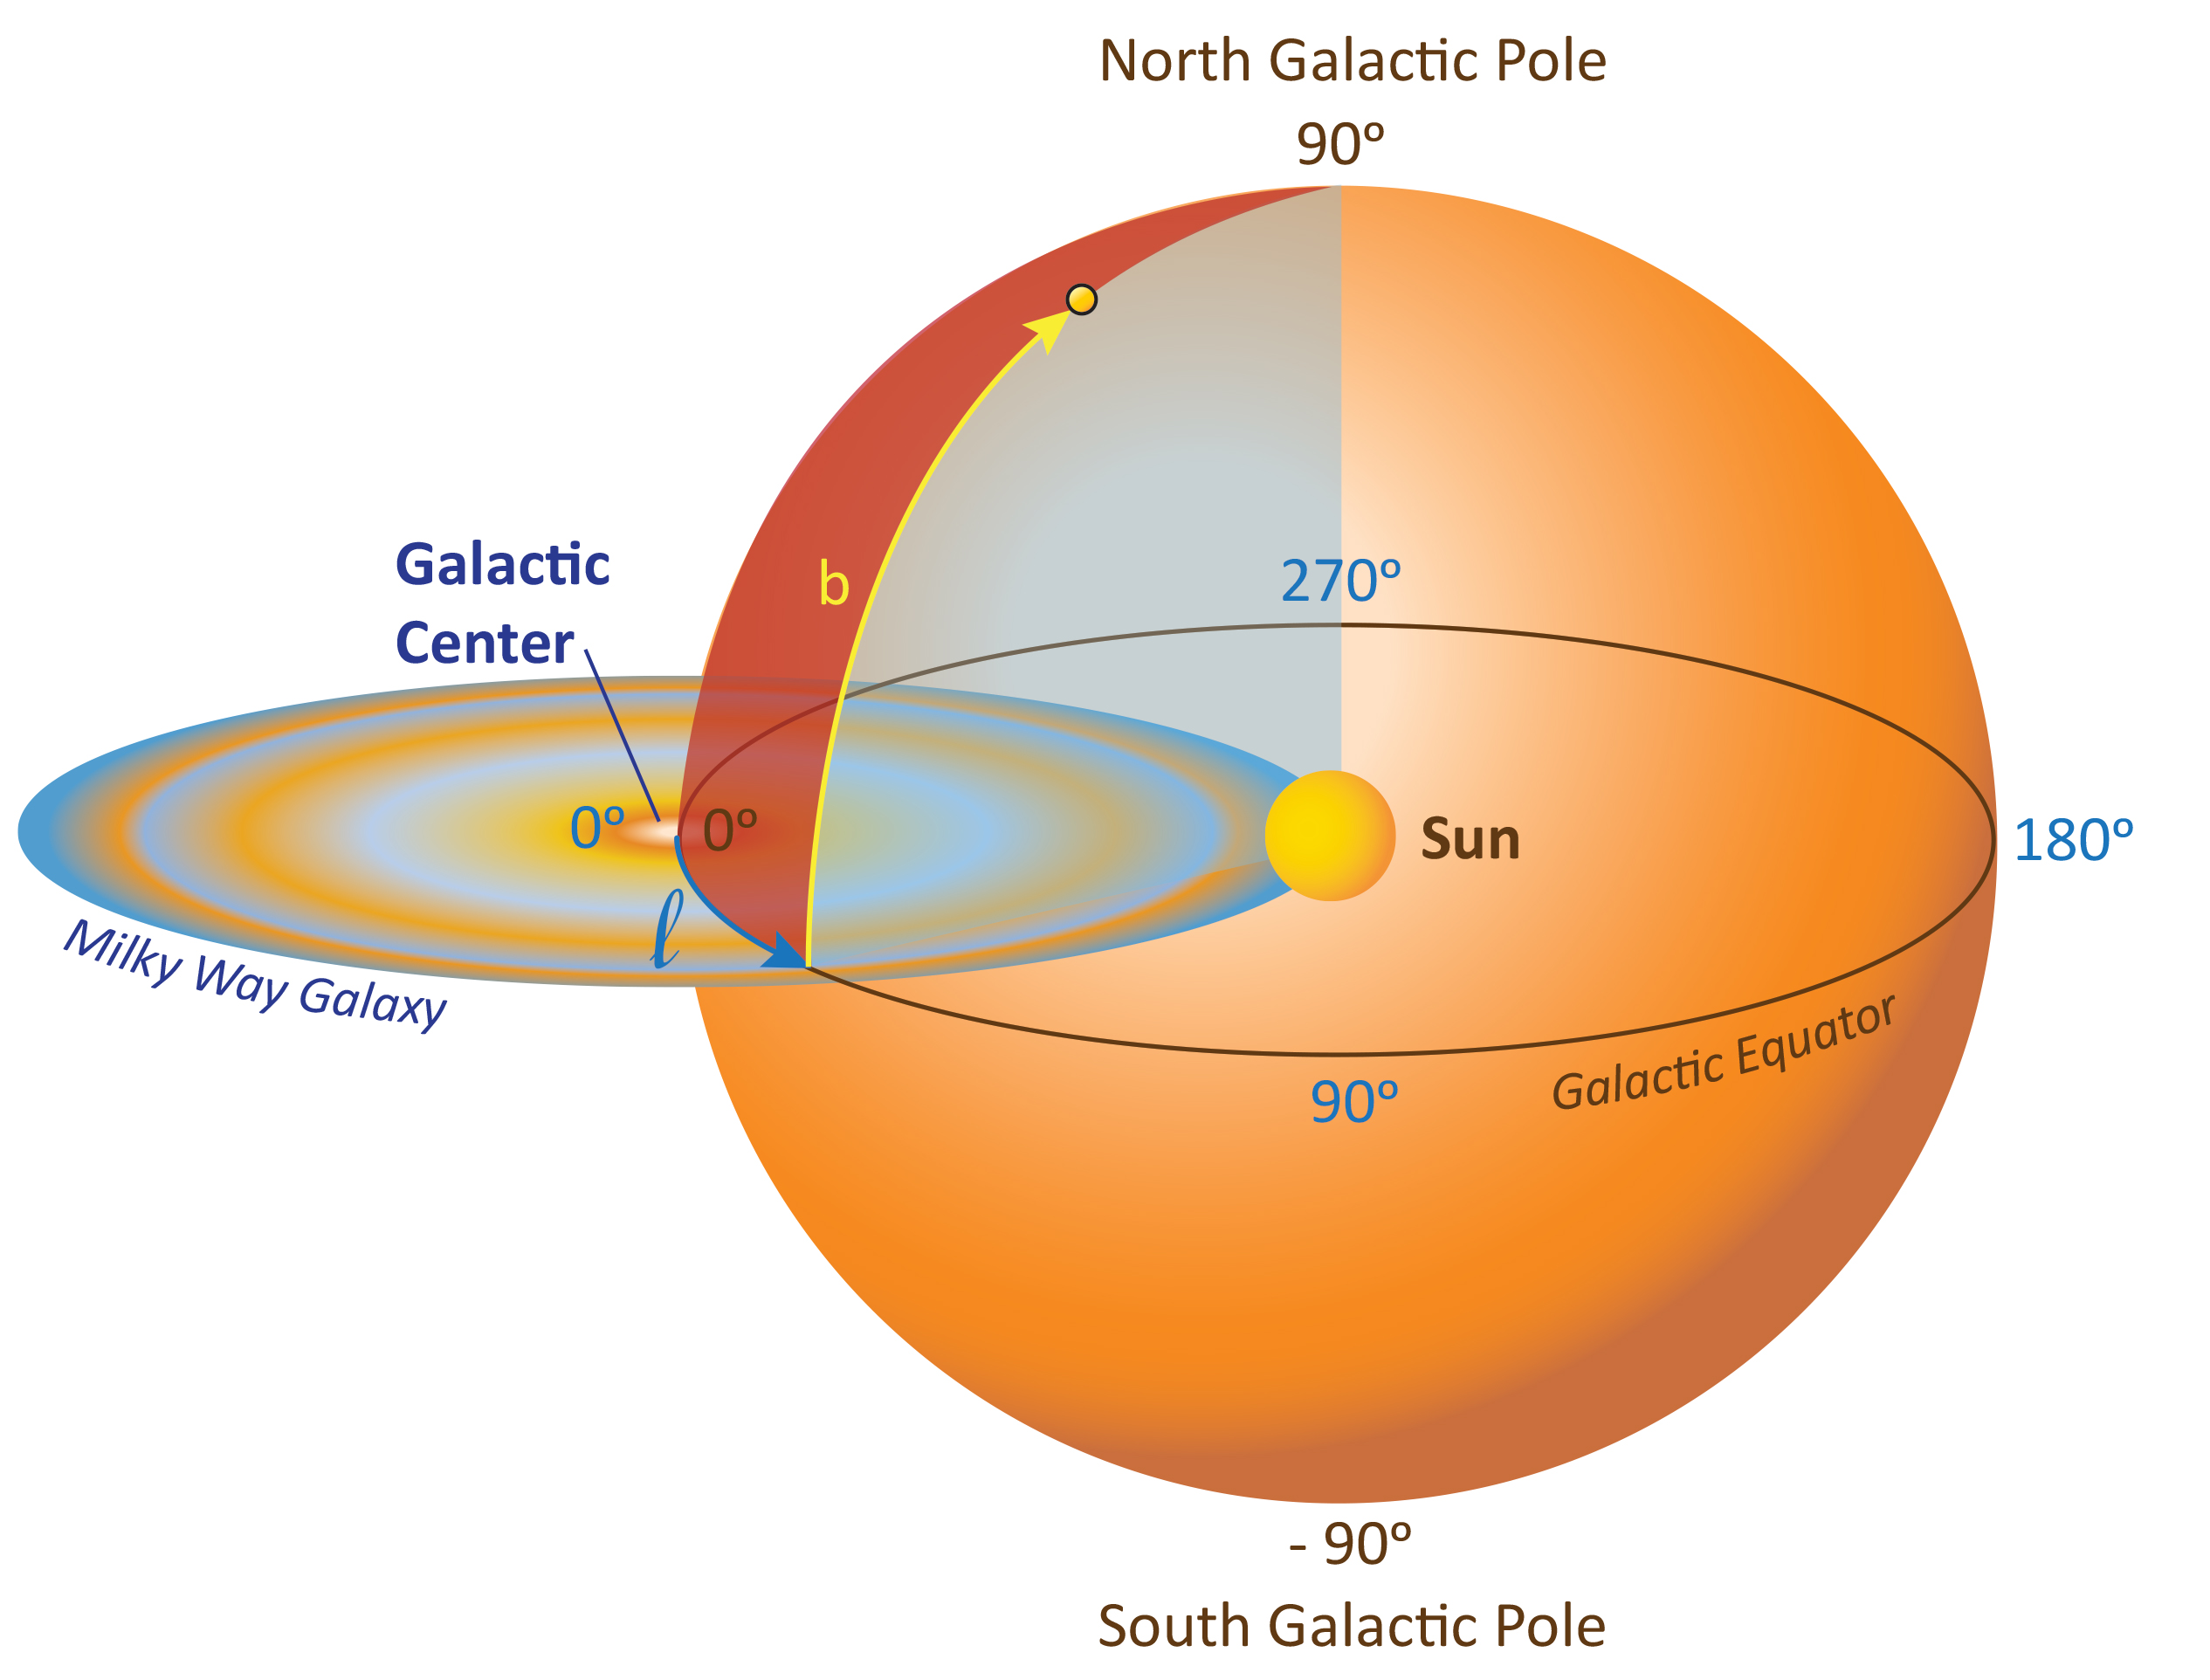
The burst location is measured in galactic coordinates. This system of describing an astronomical object’s location is similar to equatorial coordinates; however, it uses the Milky Way Galaxy as its reference instead of the Earth. The axes of the galactic coordinate system are galactic longitude (`l`), which measures the angular position of objects projected onto the plane of the galaxy in reference to a line connecting our Sun to the galactic center, and galactic latitude (b), which measures the angular position of objects above or below the plane of the Milky Way as measured from the Sun. Measurements of galactic longitude can range from 0º to 360º, and measurements of galactic latitude can range from -90º to +90º (corresponding to the South and North galactic poles, respectively).
Gamma ray bursts emit photons with energies that span the electromagnetic spectrum; however, these energies are not uniformly distributed. The energy peak corresponds to the energy at which the largest number of photons associated with the given burst are detected. The base unit used to describe photon energies is the electron volt (eV), which describes the amount of kinetic energy gained by an electron when it is accelerated through a potential difference of 1 volt from rest in a vacuum. This energy is similar to the energy carried by visible light photons (~1.8-3.1 eV). X-ray photons typically have energies of between 1-50 kiloelectronvolts (keV). “Hard” X-rays or “soft” gamma rays have energies between 50-1000 keV, and gamma rays can have energy in excess of 1000 keV (1 MeV, in some cases greatly so).
The burst repetition indicates whether multiple gamma ray bursts have been associated with the same object. If yes, then the value indicates the average time between bursts. “None” indicates that no repetition has been observed, and “N/A” indicates that no information is available.
The spin or orbital period indicates whether the object has been observed spinning or orbiting another object. “None” indicates no observed spin or orbital period, and “N/A” indicates that no information is available.
The optical source indicates the object observed at the source of the gamma ray burst using optical wavelengths of light. These objects may be associated with distant galaxies or supernova remnants (SNRs).
The distance of the object is measured in relation to Earth and is given in light years. Can you notice any relationship between galactic latitude and object distance? What could this relationship imply?
When you’re ready, click the Gamma-ray Burst Game tab at the top of the page!
Post-Game Reading
As scientists began to gather data on more and more GRBs, it became clear that the events being studied were heterogeneous. Some of the GRBs lasted for fractions of a second (short GRBs), while others dragged on for up to a minute or more (long GRBs). Although the overwhelming majority of detected GRBs were singular events, some appeared to originate from the same point in the sky several times (soft gamma repeaters, or SGRs). The differences in properties between each type of GRB implies differing causal mechanisms, and additional observations have verified this to be the case. Although only a handful of SGRs have been detected to date, all of them have been associated with magnetars – a type of neutron star with an exceptionally intense magnetic field. Although the exact mechanism isn’t precisely known, SGRs are thought to originate from disruptions in the magnetar’s surface brought about by sudden changes in their magnetic fields. These events are referred to as “soft” gamma-ray repeaters because their emission peaks tend to be in a lower (or “softer”) energy band of gamma rays than the emission peaks of true GRBs.
Long GRBs are the most numerous type of GRB detected thus far, and many of them appear to originate from highly active star-forming regions of galaxies. Many long GRBs have been associated with core-collapse supernovae of supermassive stars – in particular, those stars with 50 to 100 times the mass of the Sun and whose death results in the birth of a black hole. Short GRBs have historically presented more challenges for researchers due to the rapid nature of their evolution and the difficulty in finding associated afterglows (visible light emitted after the initial blast of gamma rays). For many years, the leading hypothesis for the cause of short GRBs involved compact binary systems of either two neutron stars or a neutron star and a black hole. Einstein’s general theory of relativity predicts that such systems will lose energy over time due to the emission of gravitational waves, ultimately leading to the decay of their mutual orbits until the two objects tear each other apart and coalesce into a black hole surrounded by the swirling mass ejected from the former binary pair. The event is predicted to be energetic enough to briefly emit intense gamma rays. Strong evidence in support of this hypothesis was recently provided when the Laser Interferometer Gravitational-Wave Observatory (LIGO) detected a gravitational wave signature (GW170817) consistent with the merging of two neutron stars within 1.7 seconds of the detection of a short GRB (GRB 170817A) by NASA’s Fermi Gamma-ray Space Telescope (Fermi) originating from the same location in the sky.
