
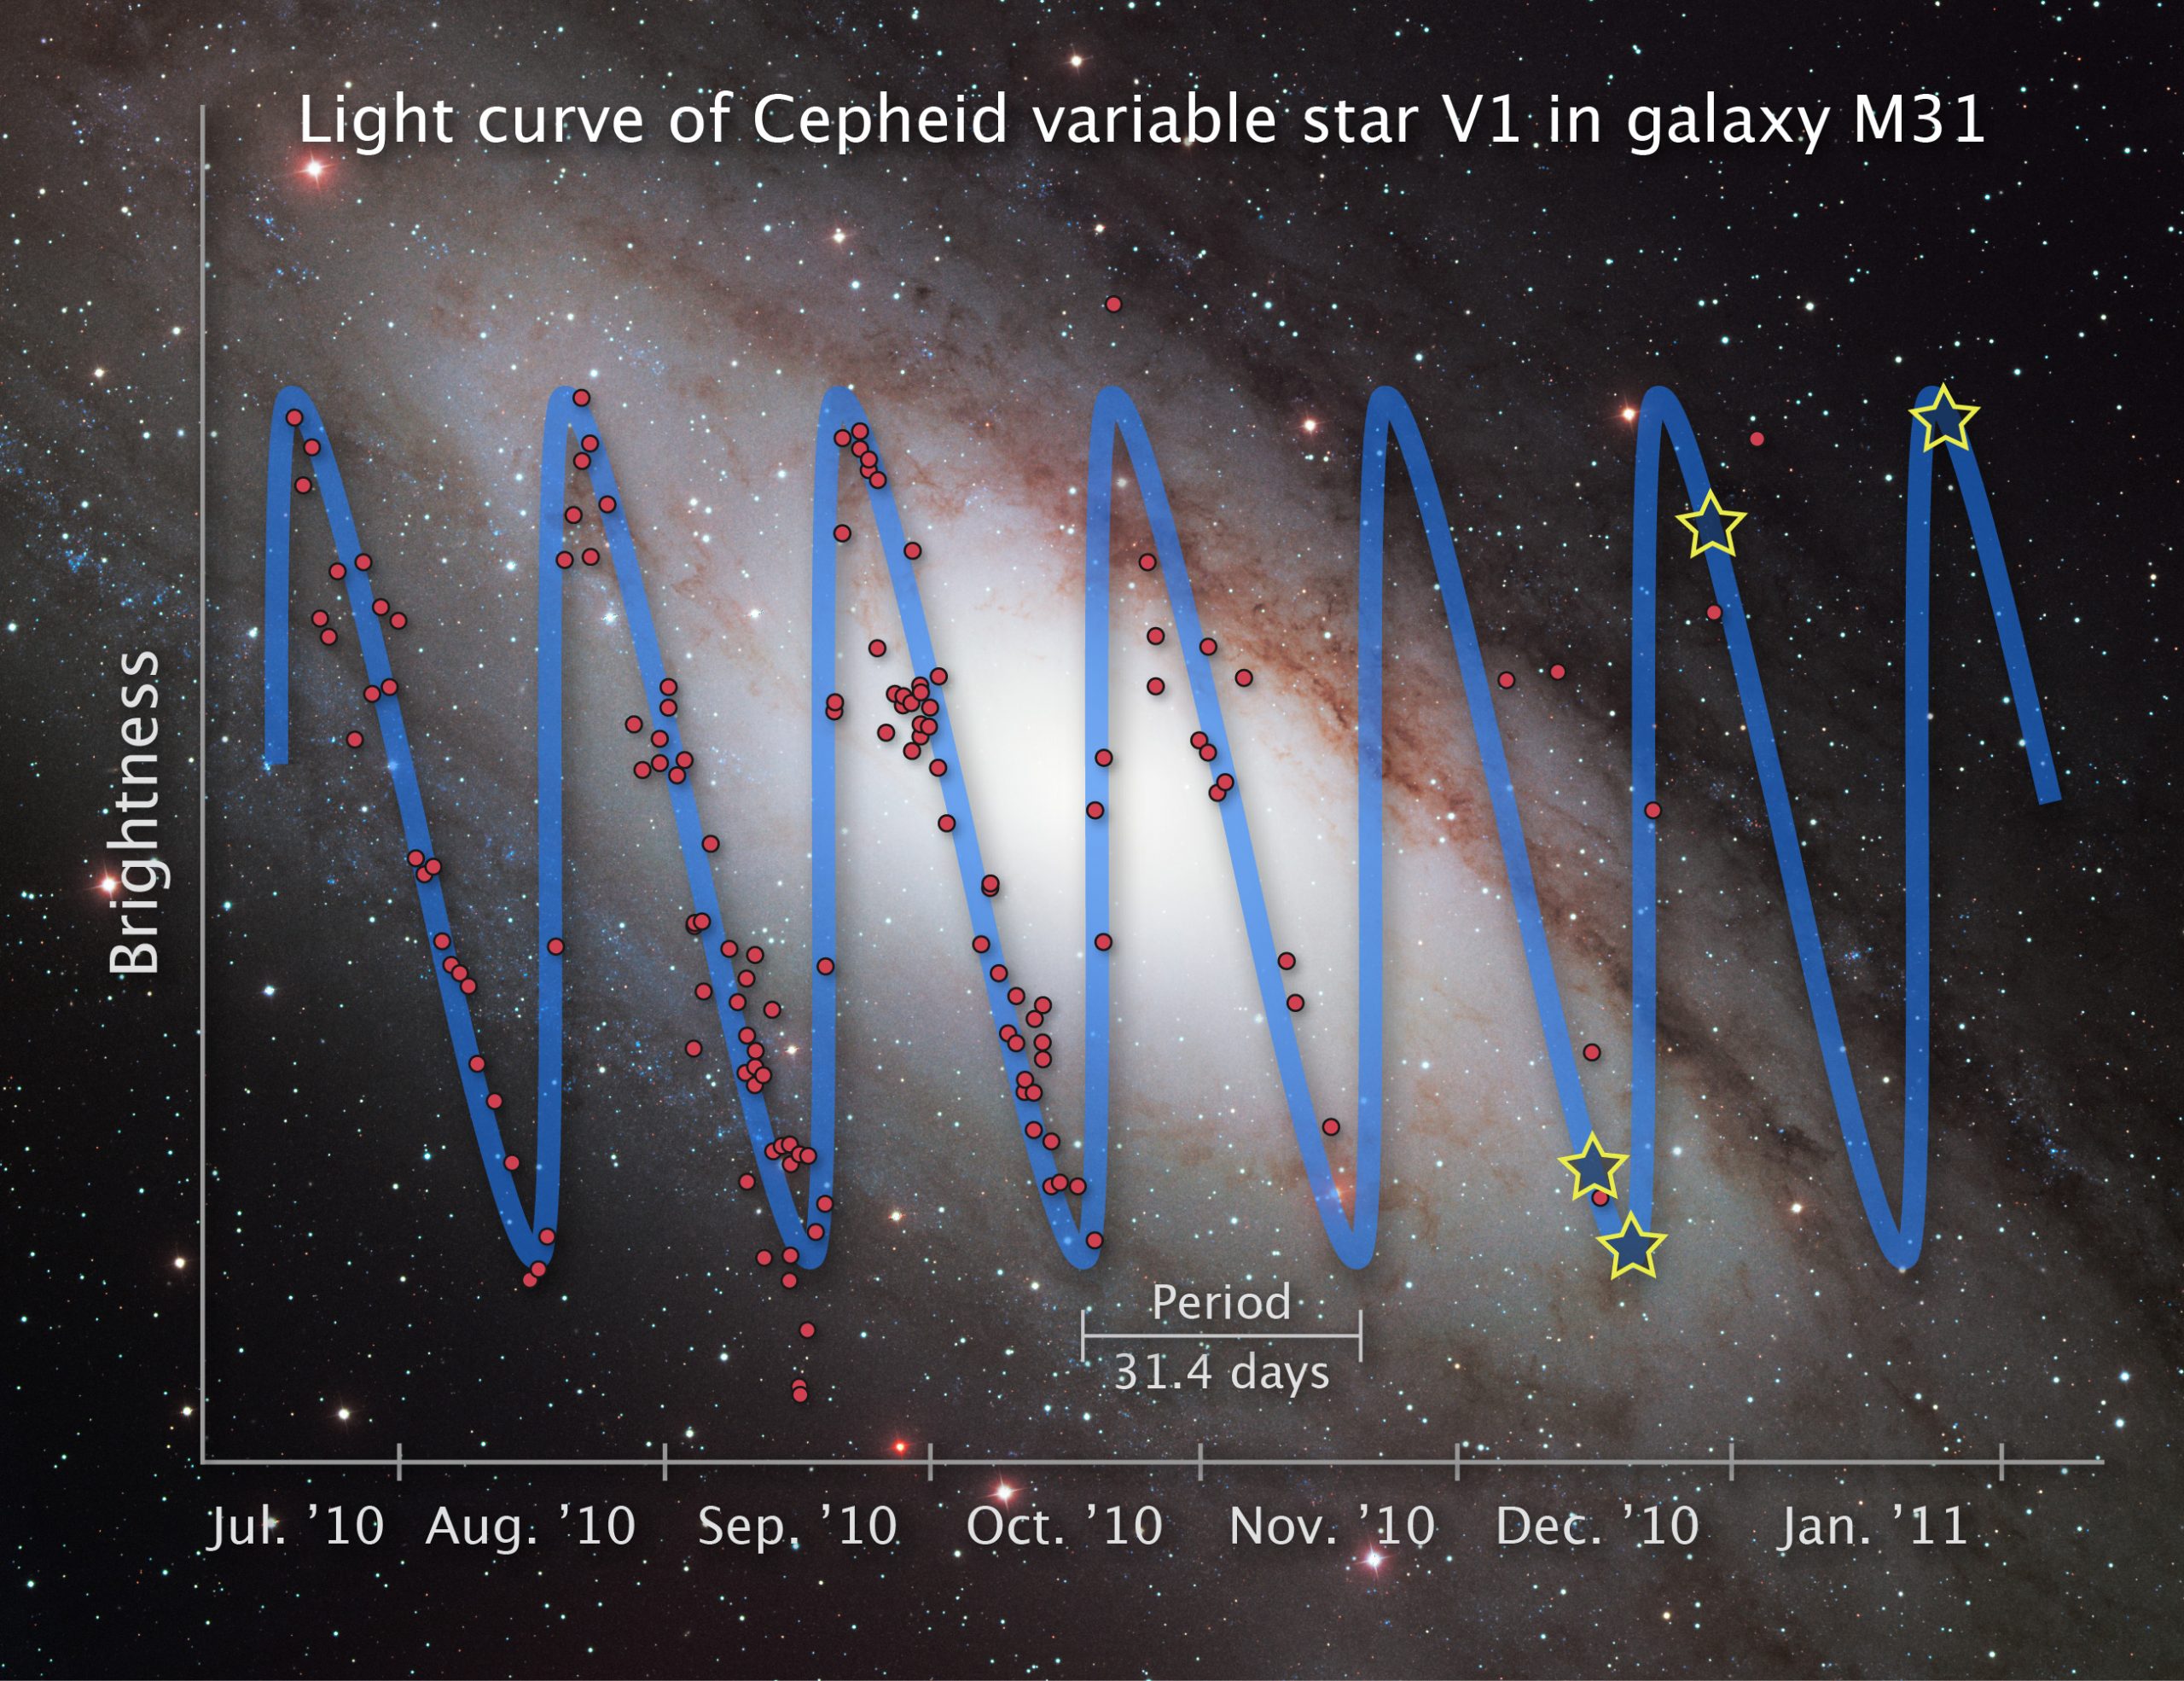
Light curve of Cepheid variable V1 in our neighbor, the Andromeda galaxy. Red points denote data taken by amateur astronomers and stars indicate four observations by the Hubble Space Telescope.
In the early 1900s, astronomers began to build telescopes that were large enough to see fuzzy blobs that surrounded stars. Opinions differed as to whether the fuzzy blobs – called nebulae – were within our Milky Way Galaxy or if they were entirely separate galaxies at a greater distance. Some of the first evidence that these nebulae were indeed individual galaxies was obtained by Henrietta Leavitt, who studied stars that were regularly brightening and dimming, emitting pulses of light. These stars are called Cepheid variables, and the relationship between their pulsation period and their peak brightness would become known as Leavitt’s Law. Even though Cepheids were briefly confused with another type of pulsing star, eventually Edwin Hubble would use Leavitt’s Law to determine that the nebulae were actually galaxies, and that the universe was expanding.
In this exercise, you will learn how to measure the brightness and the pulsation period of a Cepheid. When you combine this analysis with additional Cepheid measurements you will be able to reproduce Leavitt’s Law. And if you also include Cepheid measurements both within and outside the Milky Way galaxy, you can follow in Hubble’s footsteps, producing evidence for the expansion of the universe! Click the “Build a Light Curve” link on the top left to continue to the activity.
The goal of this procedure is to obtain the relative brightness of a Cepheid, known as “AP Her.” The brightness of AP Her has been measured since before 1965. The periodic change in brightening and dimming occurs over a time period of about 10.4 days. You will start to make these measurements yourself using the AfH GORT telescope images. Each image contains AP Her as a bright star.
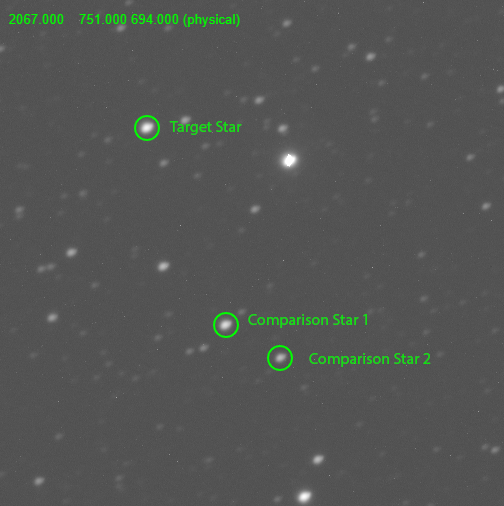
AP Her is the target star with respect to two (or possibly more) comparison stars. Below are two windows: the Finder Chart window below on the left shows an image of the target star and two comparison stars. In the window on the right, you will use a software tool called JS9 to perform the image analysis. First, you will select a region that includes the target star, and measure the brightness in that region. Then you will select each of the two comparison stars and measure their brightnesses. The comparison stars were chosen because they are known to have a constant brightness. By comparing the brightness measurement of the target to the average brightness of the two comparison stars, you will be able to tell if the target star has changed in brightness.
However, there is a limitation with this data analysis approach. – it cannot measure the true brightness of the target, only the relative brightness. Relative brightness is a number which can be close to 0.0 (zero, target is very faint), near 1.0 (one, target is near the average brightness of the comparison stars), or greater than 1.0 (target is brighter than the average brightness of the comparison stars). Measuring relative brightness for a series of images creates a plot called a light curve. Follow these steps to use a software tool called JS9 to create a light curve for the example star, which periodically brightens and dims as the star expands and contracts.
1. Press the T1 Button to load the first Cepheid image.
2. Press the LOG button in the JS9 window to make it easier to see the stars. If you click and drag the mouse across the JS9 window you will be able to adjust the contrast of the image.
3. On the finder chart below, your target Cepheid is circled at the top left of the chart. Use the two comparison stars that are circled on the finder chart at the bottom right.
4. Open the Magnifier Box by pressing the Magnifier Button.
5. Move the Magnifier Box so it doesn’t block buttons or boxes.
6. Press the add region button to load in a circle that you will use to measure the brightness of the Cepheid as well as the brightness of the different comparison stars. Once you have clicked on the circle, use the arrow keys on the keyboard to move the circle more precisely. If you end up with more than one circle click your extra circle and press the delete key on your keyboard.
7. Drag the circle to your target Cepheid and click ‘Target’.
8. Drag the circle to comparison star 1, as shown circled and labeled on the finder chart and click the Comp 1 Button.
9. Drag the circle to comparison star 2, as shown circled and labeled on the finder chart and click the Comp 2 Button.
10. Click ‘Plot’ to plot the background subtracted results of your image.
Repeat these steps for each of the available Cepheid images (T1-T5).
Finder Chart
Region Pixel Counts:
If you think you understand the data analysis steps, you can have the rest of the points drawn on the plot by clicking the Draw Complete Chart button below. If you want more practice, close this box and continue selecting data. You can always click on Complete Chart button above, if you change your mind. If you do not wish to have the chart auto complete click anywhere outside of the textbox to close this prompt.