
(30 Points)
In this project you will do a pair of activities (including the going further section) to learn how astronomers use color information to search for different classes of objects.
Please turn in a write-up of your work that includes all data tables and color-color diagrams and answers to the questions below. You may use the data table and graph in this project or you may use your favorite spreadsheet/graphing program to create your color-color diagrams (like Microsoft Excel or Google Sheets). There is a separate spreadsheet file with templates for the data tables and diagrams already set up, if you wish to use them.
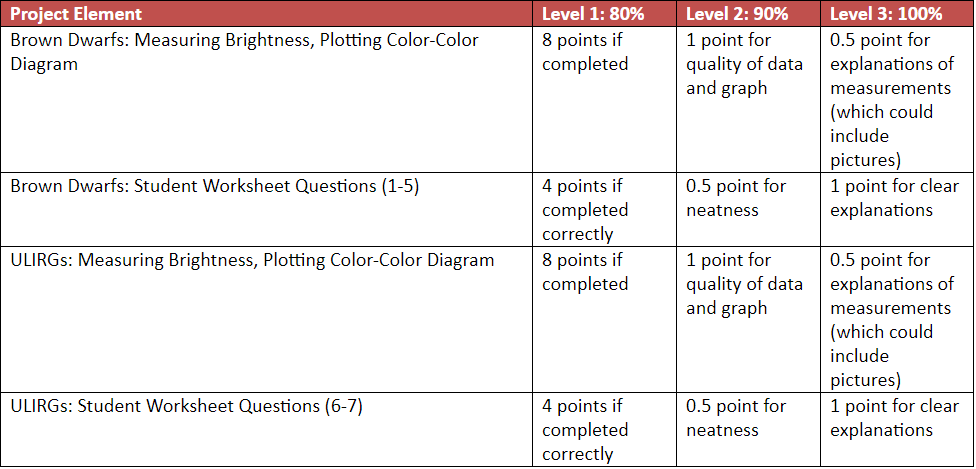
Grading Rubric
Light Detectives
(30 points)
Using NASA’s WISE Data to Identify Brown Dwarfs and ULIRGs
If you have ever looked at the sky through a telescope on a dark night, stars were not the only celestial bodies within your field of view. Space is filled not only with stars, but planets, asteroids, giant clouds of dust and gas (nebulae), white dwarfs, brown dwarfs, and entire galaxies. Astronomers are able to distinguish between objects and learn about their properties by the observing and analyzing the light they emit.
Every type of light, or electromagnetic radiation, is associated with a wavelength and energy. The characteristics of the light emitted by an astronomical body can provide clues about things like its composition, temperature, size, mass, and how it interacts with its environment. The goal of NASA’s WISE mission is to take a detailed look at space in infrared light. In this activity, you will learn to identify a class of objects that have very distinct features when observed in this part of the electromagnetic spectrum: brown dwarfs. In the Going Further section, you will extend this knowledge to look for another type of object: Ultra-Luminous Infrared Galaxies (ULIRGs).
Brown Dwarfs
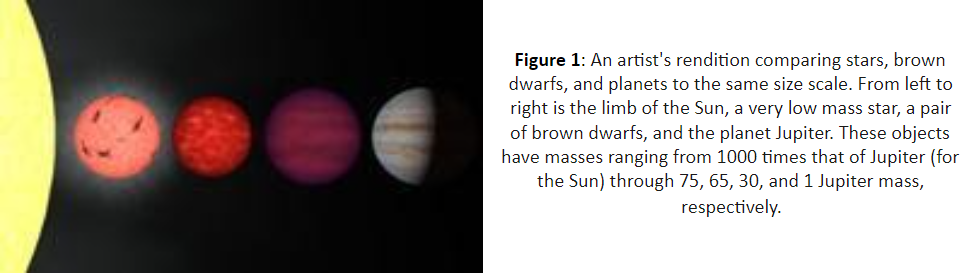
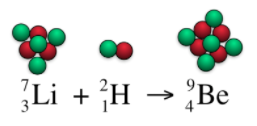
A brown dwarf is an astronomical object that, when it was formed, did not quite have the mass necessary to become a star. On the inside of stars, hydrogen atoms join together and become helium, releasing energy in the process; hydrogen is the “fuel” that causes stars to shine. This process is called nuclear fusion. In brown dwarfs, fusion also occurs, but it is sporadic and not sustained for very long because they do not have the required high temperature and density. In a brown dwarf, lithium and deuterium act as the fuel, rather than hydrogen, because they can fuse in the cooler, less dense environments inside.
For most brown dwarfs, fusion does not last for long. After a brown dwarf stops fusion and cools down, it generates energy only through gravitational contraction. Planets, by comparison, never generate nuclear fusion reactions and usually form in a disk surrounding a star (or a brown dwarf). The masses of brown dwarfs range from about 13 times the mass of Jupiter to about 80 times the mass of Jupiter. Objects less massive than 13 times the mass of Jupiter would be classified as giant planets; objects more massive than 80 times the mass of Jupiter probably fuse hydrogen sustainably and would be called stars. Brown dwarfs are one kind of object that NASA’s WISE mission searched for. They are thought to be very common, perhaps even more common than stars. But they are difficult to find, because they are very cool and therefore very dim. They give off very little visible light, which is why they are called “brown”—they are not completely black, but very dark. The kind of light that they mostly emit is infrared, and WISE was tuned to search for them.
Visit the following website for a lesson on the nature of light: http://mwmw.gsfc.nasa.gov/
Procedure
Explore: Finding and downloading the data (images)
-
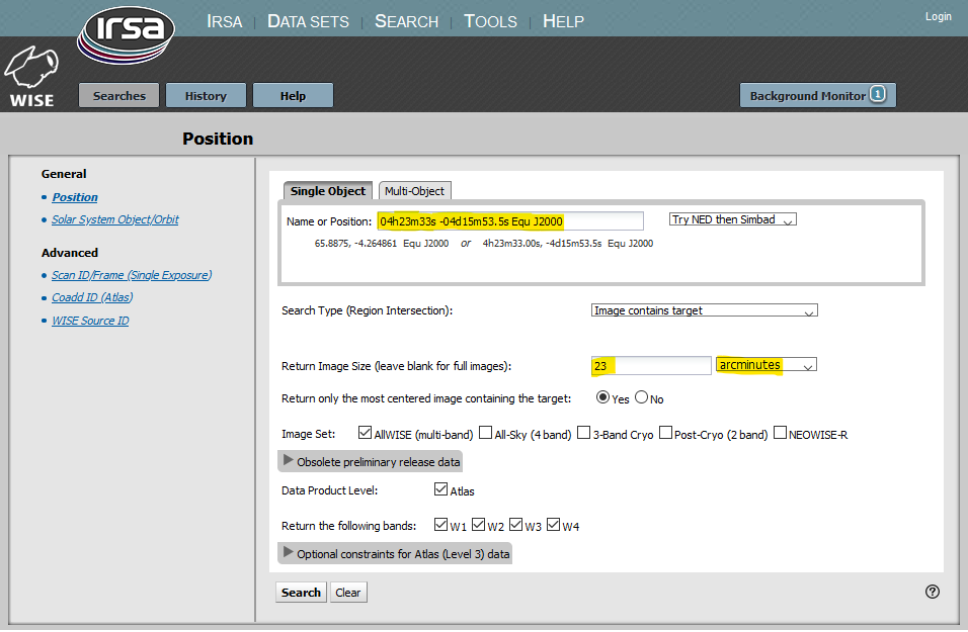
- Go to the WISE Image Service: http://irsa.ipac.caltech.edu/applications/wise Here is what the home screen looks like:
-
- In the “Single Objects” tab, type the following coordinates into the space following “Name or Position”:
04h23m33s -04d15m53.5s Equ J2000
This is the location of the field in which you will search for Brown Dwarfs.
- Where it says “Return Image Size (leave blank for full images)”,
- first, select the “Arc Minutes” option from the pull-down menu.
- then enter 23 into the box (this is the size of the field you will search).
- Leave the other default items selected and click the “Search” button.
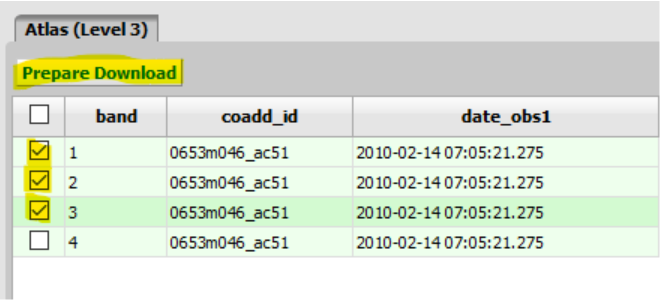
- On the next page you will see a variety of images on the left and bottom, as well as four green rows with a lot of numbers (if you want to learn more about these images, as well as how to get other infrared images from WISE then click here). To download the image data, check the boxes next to the first three green rows, then click the “Prepare Download” button.
- In the “Single Objects” tab, type the following coordinates into the space following “Name or Position”:
-
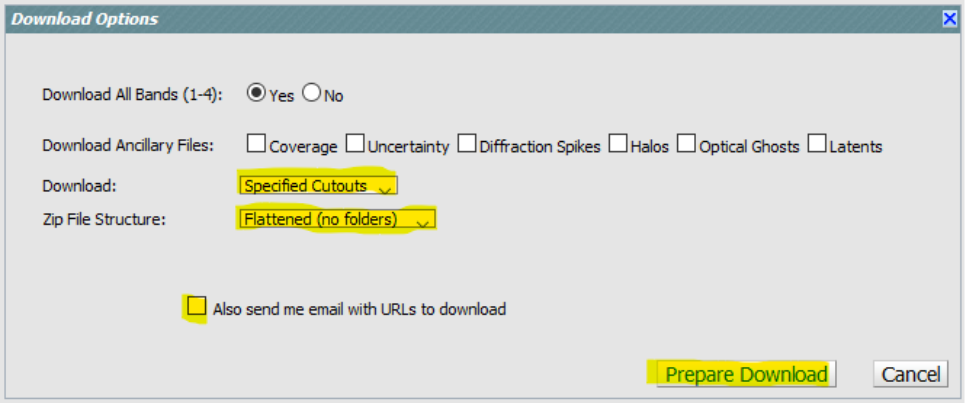
- This brings up a dialog box (see below).
- For “Download All Bands (1-4)” select “No”.
- For “Zip File Structure” select “Flattened (no folders)”.
- Unclick the box “Send me email with URLs to download”
- Leave the other items as they are and click “Prepare Download.”
- This brings up a dialog box (see below).
- Once the download is complete, it should prompt you to save a file (if not, click on the link in the top right corner,

then Download Now). Save the data file “WISE_Files.zip” to a location on the computer that you will be able to access (such as the desktop). If your browser is set to automatically download files it may not ask you where to save the file and will put it in a default folder (often called Downloads).
Extracting the data from the Zip file may require special software on your computer depending on your operating system. Some operating systems come with software built in to extract files from Zip files. Others may not. In those cases you can find free programs online to do the trick: For Windows try 7-Zip, For Mac try StuffIt Expander.
The images that come from the WISE archive are in the FITS format [Flexible Image Transport System]. FITS is the most common format used in astronomy because FITS files can provide much more scientifically valuable information than other, more common, image file formats like JPEG, TIFF, PNG, and GIF. However, the most commonly used image processing software programs, such as Adobe Photoshop, typically don’t recognize these FITS files, which is why we are using JS9.
Congrats! You have just downloaded real
data (images) from a NASA space telescope!These are the exact same data that astronomers are using.
Light Detectives
(Student Guide)
Using NASA’s WISE Data to Identify Brown Dwarfs and ULIRGs
Searching for Brown Dwarfs Using JS9
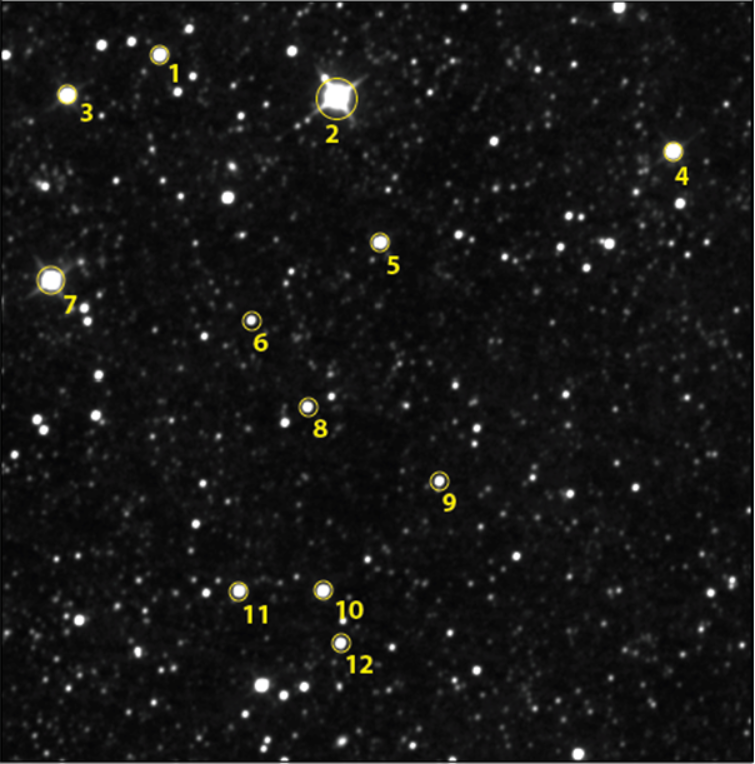
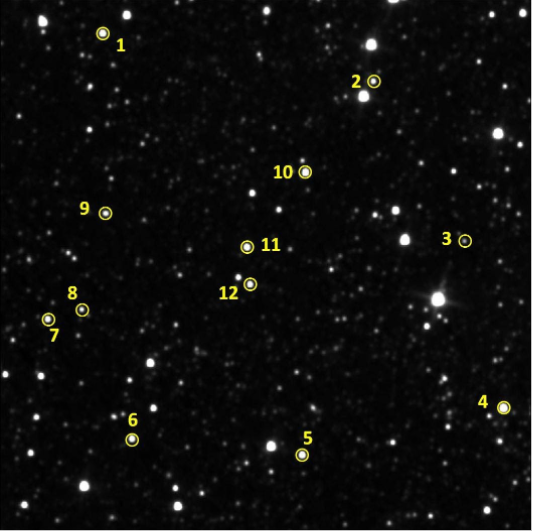
Brown Dwarf Finder Chart
-
- You will use JS9-4L to measure the brightness of stars in the field of view in the 3 different wavelength channels you just acquired from NASA’s WISE mission (https://afh.sonoma.edu/light-detectives-test-2/)
-
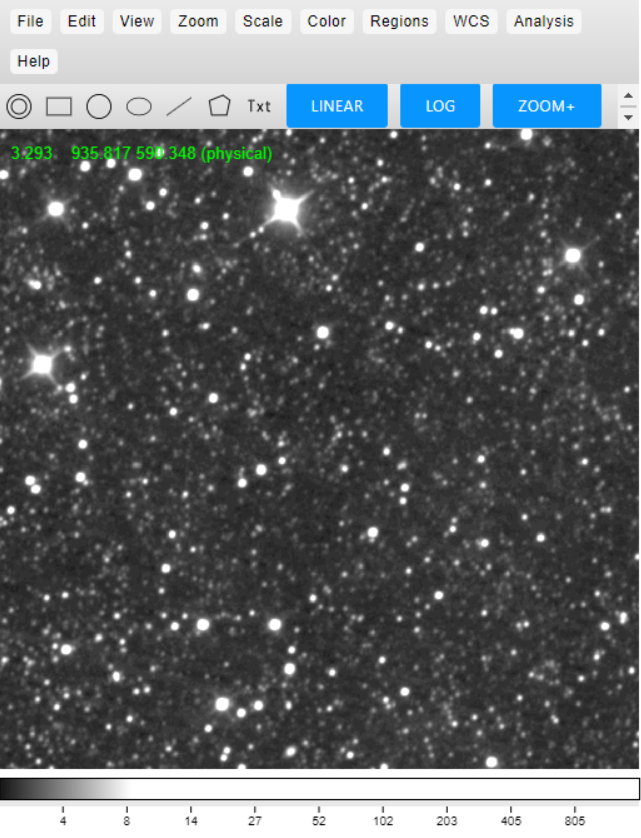
- Go to the File menu and open the three unzipped images you just downloaded (File > open > local file). Dragging and dropping the unzipped files into the JS9-4L pane also works. The first image will have -w1- in the middle of its file name. This is the WISE image taken in the W1 (3.4 μm) band. Let’s look at this one first.
- Compare the image to the finder chart (above) and make sure you can see all of the objects that are labeled on the finder chart.
- First set the view to see the whole image: Zoom > zoom to fit
- Next apply a Log-stretch to the displayed image: Scale > Log
- Finally, Left-click and drag toward the upper left corner/left middle of the image to get a nice display stretch that pulls out the fainter sources without saturating the bright sources.
- Now we’ll set up the tool we’re going to use to measure the brightness of the objects in the image. Click on the Regions > Circle. This will draw a circle on the image, which we can use for our photometry aperture.
- Select and Drag the Circle over to your first target star (#1 labelled on the finder chart).
- Select Regions > selected regions > edit. This will pull up a dialog box.
-
- FK5 to physical
- Edit 3rd box (circle radius) to 10.0. Click Apply
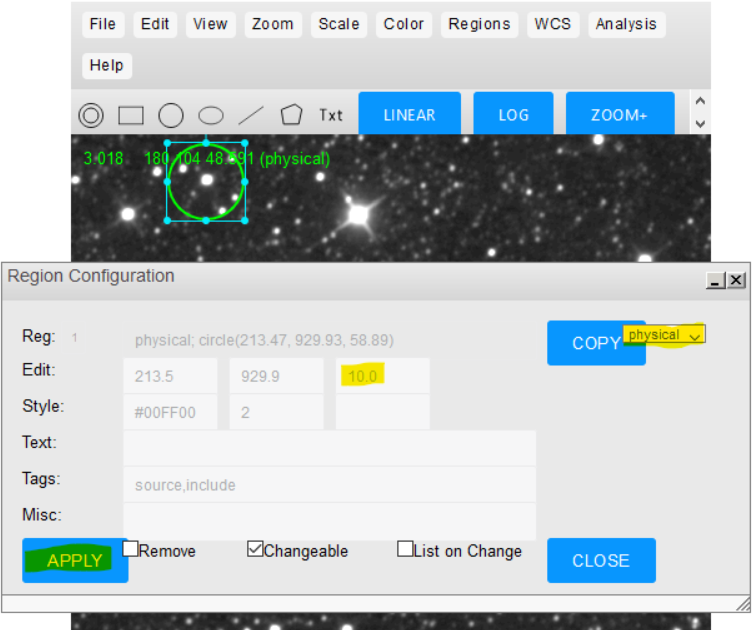
-
- This will shrink the circle down to 10 pixels in radius. You may need to Zoom in on the main window (from the Zoom menu or use + on your keyboard). Then use the magnifier (View > Magnifier) to adjust region centering (using arrow keys) to help center the circle on the target star.
- We’re ready to start measuring the brightness. Select Analysis > Region Stats (need to first click off the region, and then click back on it). This will pull up another dialog box with the values of the total counts of the pixels inside the aperture (totcounts) and the value of the total counts minus the median sky counts (bscounts; determined by the software in a predetermined annulus around the aperture).
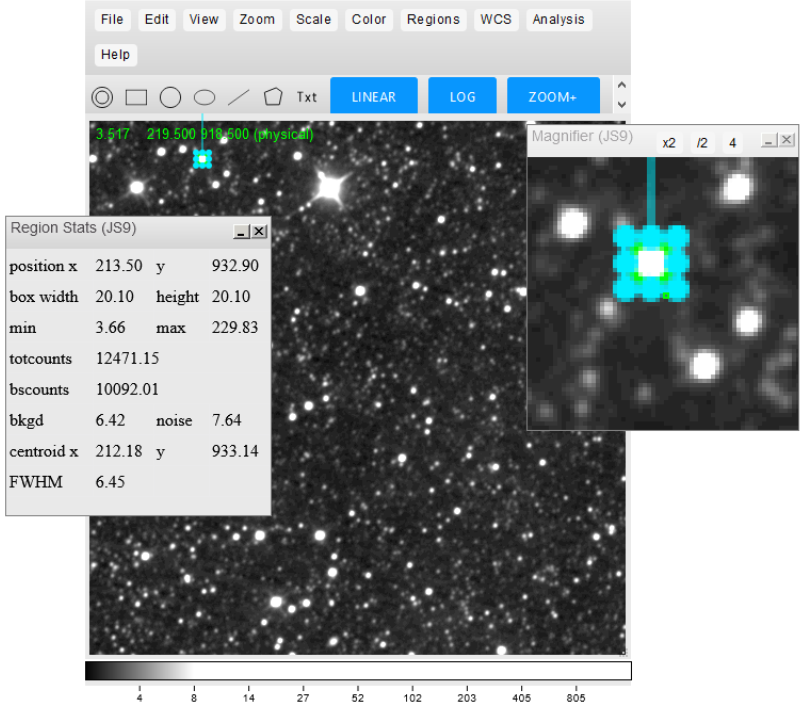
-
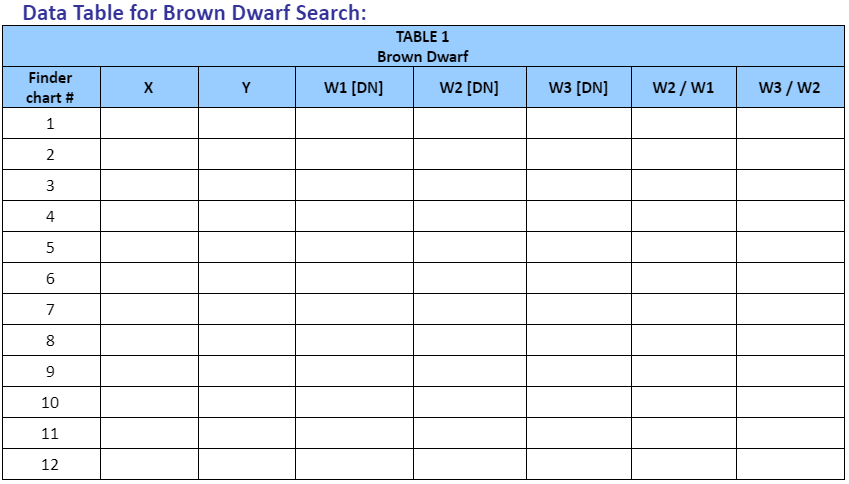
- Copy the following numbers onto your data table (in the Google Sheet, select File > Make a copy):
x,y, Star’s Intensity (bscounts)
Put the intensity under the “W1 [DN]” column (only the digits before the decimal point).
The first two numbers, x and y, are the location of the object. The third number, the intensity in units of digital numbers (DN), tells you how much light is coming from the object. A DN is proportional to the count of photons of light that impacted the detector at a given pixel in a given period of time.
- Measure the rest of the finder chart objects in order in this same way. If you mess up, just highlight the erroneous row in the data table and choose Edit -> Cut. Stop when you get to object #12, and make sure you’ve put the right numbers in the right places in your data table.
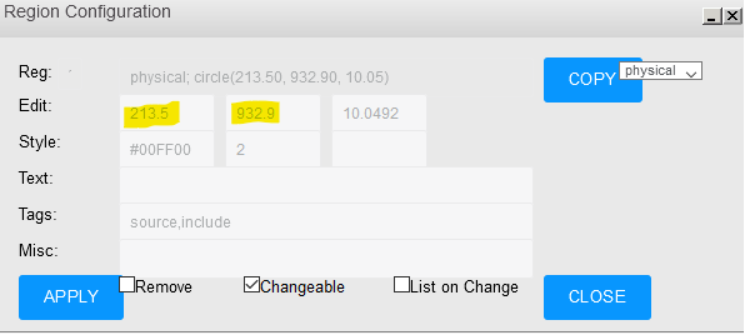
- Open the next image: the -w2- image (in 4.6 μm). It is important you identify the same stars in the image. The finder chart and the star’s location (x, y) can help you with this (the x or y coordinates may drift by a pixel or two between the different images, but no more than two). For each of the stars you measured before, measure the same star again in the new image and add that data to the table. This new data goes in the next column labeled W2 [DN]. You can easily send the aperture to a specific x,y coordinate using Regions > selected regions > edit. Just edit the x,y coordinates there and click Apply. The values in the Region Stats panel will automatically update. You can select the circle and fine tune the centering using the magnifier and arrow keys if needed.
- Copy the following numbers onto your data table (in the Google Sheet, select File > Make a copy):
- Repeat for the third image: -w3- (in 12 μm). It is important you identify the same objects in the same order (several objects are tricky in the -w3- image, as they are very, very faint). Use the x and y coordinates determined from w1, same as in the previous step.
Plotting the Color-Color Diagram
-
- Astronomers can distinguish brown dwarfs from other objects by comparing their intensities in different wavelengths. You’ll be doing this same thing, by computing the ratios of intensities between the three images (wavelengths) you just measured. This means that for each object, you should divide the W2 intensity by the W1 intensity. Also take W3 and divide by W2. These values can be recorded in the last two columns of the table. Keep in mind that ratios may be less than 1. (The Google Sheet is set up to do the calculations automatically)
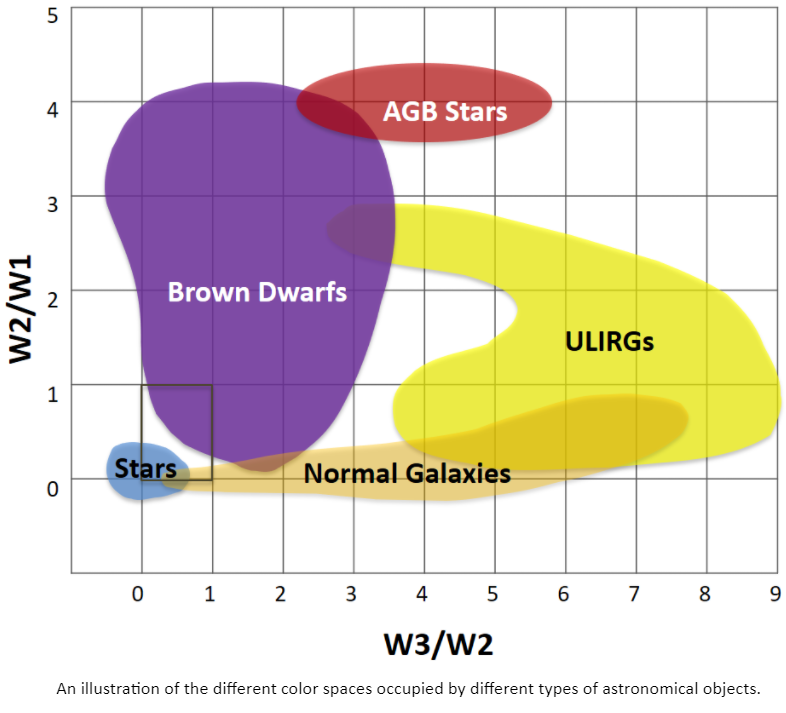
- For each object, plot W3/W2 on the x-axis and plot the corresponding value of W2/W1 on the y-axis. This plot is called a color-color diagram. Brown dwarfs can be identified by the location these points occupy on the plot. (The Google Sheet is set up to graph the data automatically)
Light Detectives
(Student Worksheet)
Using NASA’s WISE Data to Identify Brown Dwarfs and ULIRGs
-
Photometry
In this activity, you measured the amount of light coming from each star in the finder chart. This is called photometry. Explain why the images you open on your computer (W1, W2, and W3) look slightly different from one another. In other words, why do you measure three different numbers (W1, W2, and W3) for the same star?
-
Helpful clues for a light detective. Part 1:
Brown dwarfs are expected to emit less W1 (3.4 μm) light than normal stars, so they have lower values of W1. But this is not enough to tell you whether an object is a brown dwarf or not. Why? (Hint: The objects in the finder chart are at different distances. Do you expect W1 to increase or decrease as an object moves farther away?)
-
Helpful clues for a light detective. Part 2:
Brown dwarfs are expected to have higher W2/W1 ratios than normal stars, but this is still not enough information to tell you whether or not an object is a brown dwarf. Why not? Why do you also need to know the ratio W3/W2? (Hint: Remember the color-color diagram in the slide show [Slide #11] that included galaxies, ULIRGS, and AGB stars)
-
A WISE detective:
The wavelength of light at which an object shines most brightly depends on how hot that object is. If you know the object’s temperature (T), you can find that wavelength, using this equation:
wavelength = 2900/T
- The surface temperature of a brown dwarf is about 1000 degrees Kelvin (1000 K). Use the equation to calculate the corresponding wavelength of light. Your answer will be in units of μm (microns).
- The temperature at the surface of the Sun is about 5800 K. What is the corresponding wavelength?
-
Why Infrared?:
The human eye can see light having wavelengths between 0.39 μm and 0.7 μm. Explain why we cannot see brown dwarfs with the naked eye, and why a telescope like WISE can help us to detect brown dwarfs.
Going Further: ULIRGS
An Ultra-Luminous Infrared Galaxy (ULIRG) is a type of galaxy that is 100 times more luminous in infrared light than it is in visible light. The key to this excess of infrared light is dust, which mostly emits infrared light and which astronomers observe wherever stars are forming. Thus, ULIRGs may be found in merging galaxies whose collisions lead to dust-enshrouded bursts of star formation. WISE discovered ULIRGs all over the sky.
Observing an object in different wavelengths of light helps astronomers to more fully understand that object’s properties. The various physical and chemical interactions taking place in and around a star, for instance, produce different wavelengths of light; so the star looks different depending on the wavelength in which it is observed.
-
-
Follow the exact same instructions as above in the brown dwarf activity (pages 2 – 3) to download three new images from the WISE Image Service. However, this time enter the following coordinates:
06:20:54, -63:18:10 Equ J2000
Finding ULIRGs
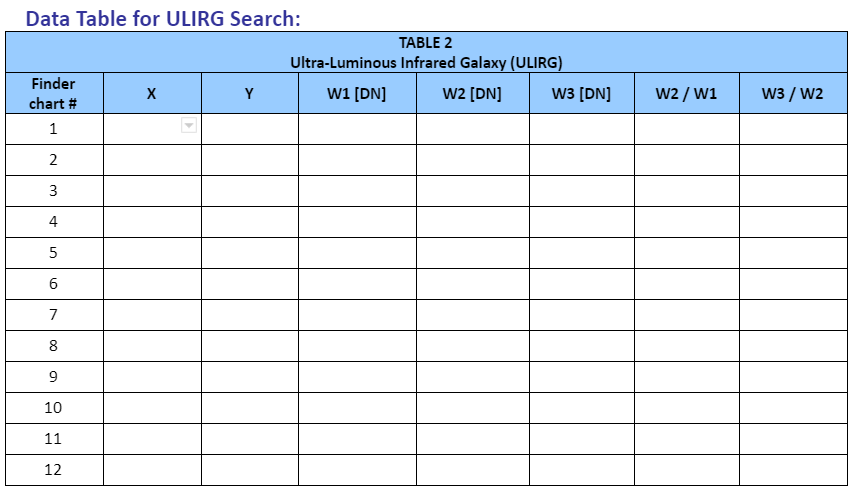
The Finder Chart below (also on slide #14) contains the list of the targets you’ll measure. The numbers are arbitrary. The same targets appear in each of the three images you’ll analyze.
-
Use JS9-4L and follow the same steps as you did in the brown dwarf activity (pages 4 – 6) to measure the brightness (intensity) of each of the objects in all three images.
Note: As before, it is important you identify the correct objects in the same order
-
Verifying it’s a ULIRG with the Hubble Space Telescope
You now probably have a very good idea about which object is likely to be a ULIRG. But what if it’s not even a galaxy? What if it’s just a strange type of star? If we could zoom in on the object and see some sort of structure, like maybe a spiral arm, that sure would help us verify that it’s a galaxy.
The WISE telescope doesn’t have high enough resolution to do this, but thankfully there’s another great telescope that does. The Hubble Space Telescope can provide just the kind of high-resolution close-up image that we’re looking for…
-
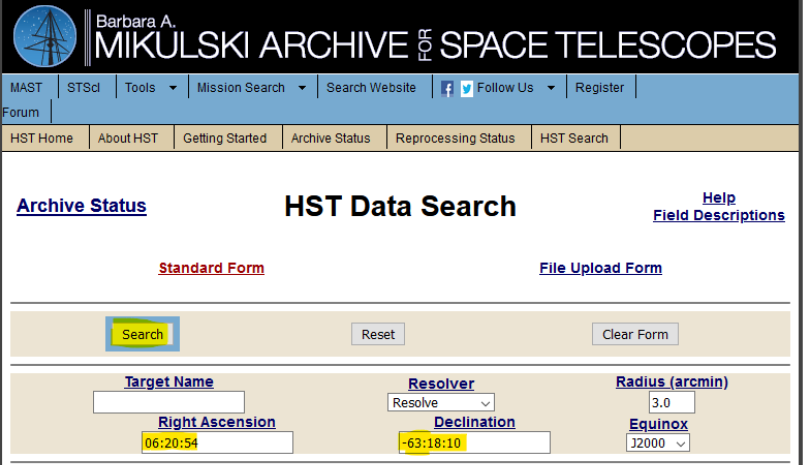
Search for this same part of the sky in the Hubble archives by going to the website https://archive.stsci.edu/hst/search.php, and entering the same coordinates as in step #1. In the box labeled Right Ascension put 06:20:54 and in the box labeled Declination put in -63:18:10
Leave the other options at their defaults and click “Search.”
-
You are taken to a web page containing all the Hubble Space Telescope (HST) images taken in that region of the sky. Look for the images with the aperture value ‘PC1’ as that is the detector with the highest resolution and click on the links in the tables under the Dataset columns to explore the images.
Do any of them show an object that looks like a galaxy? Do you see anything that might be a spiral arm?
…If so then you have discovered your first ULIRG!
Light Detectives
(Student Worksheet continued…)
Using NASA’s WISE Data to Identify Brown Dwarfs and ULIRGs
6. ULIRGs:
Why are ULIRGs to the right of brown dwarfs in the color-color diagram?
7. ULIRGs:
Why does the ULIRG look different in the WISE images compared to the in Hubble Space Telescope images?
-