OJ 287
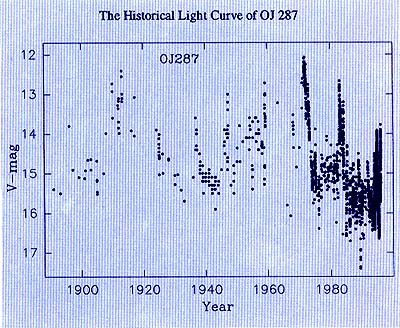
This is one of the most extensively studied blazars. Photographic observations extend back into the late 1800s (though
note how sparse the coverage is before about 1970). Superimposed on slow undulating variations lasting several decades, there are rapid outbursts of 4 magnitudes or more. There is some weak indication of periodicity for the outbursts, with an 11 year cycle. The outbursts themselves often appear double. It has been suggested that the central supermassive blackhole driving the activity may be a binary. Takalo and Sillanpaa (1999)
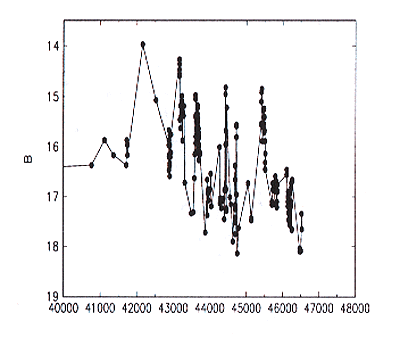
The B light curve for B2 1308+326 with respect to the modified JD. This source seems to exhibit primarily short-term outbursts. Fan and Lin (2000)
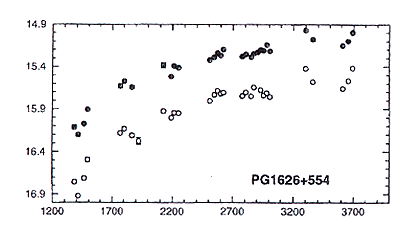
The R (filled) and B (open) lightcurves for PG 1626+554 over a period of approximately 7 years. The horizontal axis is in days. This source does not seem to exhibit violent outbursts or declines. It exhibited a modest but steady rise throughout this interval. Giveon et al. (1999)
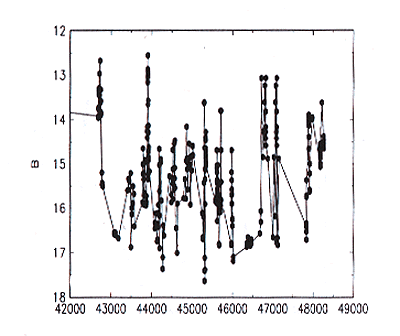
The B light curve for AO 0235+164 in terms of the modified JD. This is an extensively studied object which exhibits short-term outbursts and declines. Fan and Lin (2000)
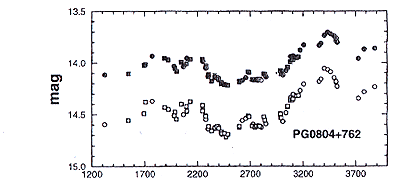
The R (filled) and B (open) lightcurves for PG 0804+762 over a period of approximately 7 years. The horizontal axis is in days. This source does not seem to exhibit violent outbursts or declines, but merely slow, irregular variations. Giveon et al. (1999)
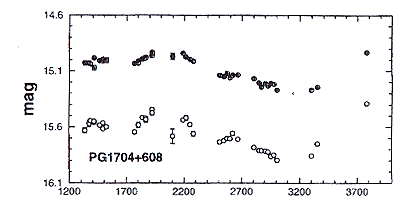
The R (filled) and B (open) lightcurves for PG 1704+608 over a period of approximately 7 years. The horizontal axis is in
days. This source does not seem to exhibit violent outbursts or declines. It exhibited only a modest decline over this interval… except for the last observation which seems to indicate that an outburst had taken place. Giveon et al. (1999)
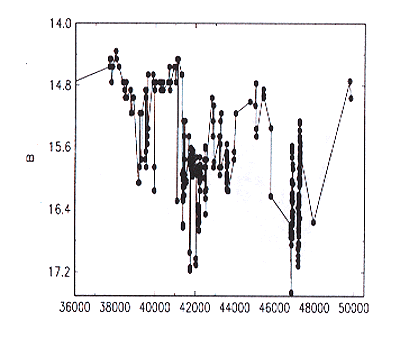
The B light curve for B2 1215+303 with respect to the modified JD. This object appears to be mostly in a “high” state that is occasionally interrupted by episodes of generally lower activity. Fan and Lin (2000)
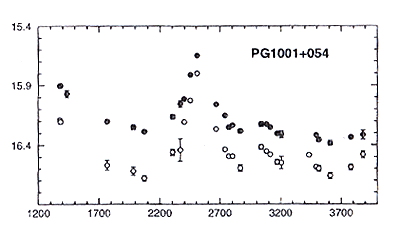
The R (filled) and B (open) lightcurves for PG 1001+054 over a period of approximately 7 years. The horizontal axis is in
days. This source does not seem to exhibit violent outbursts or declines. The general trend is a slow decline, interrupted by a modest outburst lasting approximately 600 days. Giveon et al. (1999)
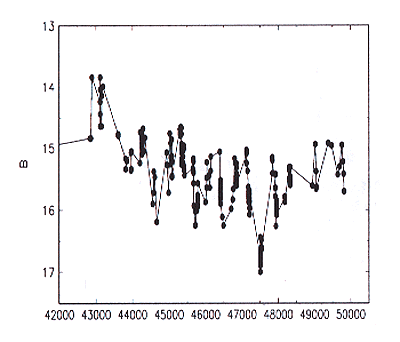
The B light curve for PKS 0754+100 with respect to the modified JD. This source exhibits moderate, irregular fluctuations of about 1 magnitude that seem to last less than a year. Occasional large, longer declines can approach 2 magnitudes. Fan and Lin (2000)
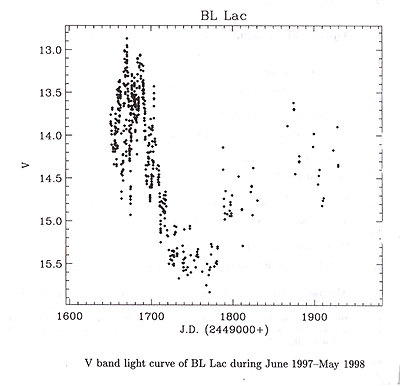
The V light curve for BL Lac over a period of about 1 year. In addition to the slow irregular variation of 2 magnitudes over this period, irregular outbursts and declines of more than 1 magnitude can be seen to occur over periods of several days. Tosti et al. (1999)
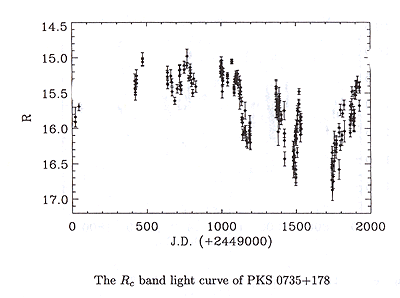
The R lightcurve fpr PKS 0735+178 over a period of about 6 years. During periods of coverage, significant variation of nearly 2 magnitudes can be seen over periods of several months. Significant variations over several days are clearly evident in the data. Tosti et al. (1999)
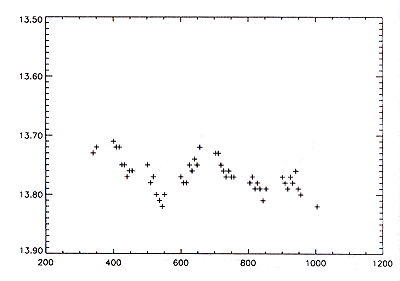
The magnitude variation (unspecified band) for Mrk 421 on 13 March 1981. The x-axis is the UT in hours (200 = 2h UT). Superimposed on a slow decline, three irregular mini-outbursts of about 0.1 magnitude were recorded. Mrk 421 has been detected as a source of TeV gamma-rays. Miller et al. (1999).
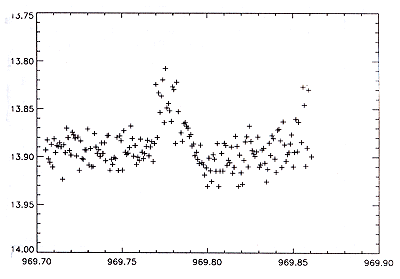
The magnitude variation (unspecified band) for Mrk 501 on 5 June 1998. The x-axis is in days and covers approximately 3 hours. The average level remained constant during this interval, but a 0.1 magnitude mini-outburst was recorded that lasted approximately one hour. A second mini-outburst had apparently begun near the end of the observations. Mrk 501 has been detected as a source of TeV gamma-rays. Miller et al. (1999)
